



OpenTelemetry · OTLP · Structured Logs · AI SDLC
OpenTelemetry Log Analysis –
Distill your OTLP Signal.
Watch it, then run it on your stack
Pick where you already work:
LOG SEVERITY
LOGS
IMPACTED RESOURCES
SUMMARY
Run it on your cluster:
Run it in one terminal:
Run it in your editor:
43%
OF AI-GENERATED CODE FAILS IN PROD WITHOUT MANUAL DEBUGGING (LIGHTRUN 2026)
77%
OF ENG LEADERS LACK CONFIDENCE IN OBSERVABILITY FOR AI OPS
80%
OF LOGS AT LARGE COMPANIES NEVER GET READ
1
OTLP EXPORTER TO ADD, NOTHING TO RIP OUT
2 min
FROM brew install gonzo TO FIRST USABLE STREAM
FIVE FAILURE MODES
Five Ways Your OTel Backend Stores Everything and Surfaces Nothing.
OpenTelemetry is the right standard. Your backend ingests the logs. The gap isn’t collection — it’s what happens when auto-instrumentation turns every HTTP call into a log line, when AI-generated code ships hourly, and when the question becomes “what’s new since the last deploy” instead of “what’s our p99.” These are the patterns Dstl8 is built to complement.
01
Auto-instrumentation gives you the haystack, not the needle
OTel auto-instrumentation is the point. Every HTTP call, DB query, middleware hop, and framework callback becomes a structured log event. Your backend ingests all of it, faithfully. None of it tells you which line is the incident.
# auto-instrumented service, average day
HTTP requests: 1.2M logs
DB queries: 3.8M logs
framework callbacks: 7.4M logs
# search: “error” → 40,000 results
# actual incidents: 3
02
DEBUG vs production is a no-win static config
Leave DEBUG on in prod: storage bill spikes, real signals drown. Turn it off: you’re blind when the AI-generated deploy breaks something subtle. Dynamic per-request filtering exists in theory. In practice, nobody has engineering budget to maintain it.
DEBUG off: blind in incident
DEBUG on: $thousands/mo extra, signal drowns
dynamic: weeks of collector engineering
# every team picks one of the three losing options
03
Your backend stores everything. It doesn’t know what’s new.
Loki, Datadog, New Relic, SigNoz, Elastic — they’re designed for search, aggregation, and long-term retention. They do that job well. What they don’t do is notice when a pattern that wasn’t there before appears, because they were built for an era of human-scale deploys. The AI SDLC has a different cadence.
# what your backend answers well
“show me error rate over 30 days”
“p99 latency for checkout-api”
“logs matching trace_id=abc”
# what it doesn’t answer
“what pattern showed up in the last hour that wasn’t there before?”
04
Dashboards live in tabs. AI-generated code lives in the editor.
The developer reviewing the patch Claude Code or Cursor just wrote doesn’t want to context-switch to Grafana to check if it’s misbehaving. The feedback loop breaks at the tab boundary.
[editor] Claude Code: “shipped fix for issue #1423”
[editor] developer: accept?
[???] is the staging environment happy?
[tab] → open dashboard
[tab] → filter by service
[tab] → scan for anomalies
[editor] flow: gone
05
“Unknown unknowns” are what AI-written code breaks
The failures you have alerts for are the failures you already knew about. AI-generated code introduces new failure modes, and by definition you haven’t built a dashboard for them yet. Your existing backend can search for them — once you know what to search for.
known failures: alerts configured ✓
known patterns: dashboards built ✓
new pattern from AI-written code: silent until someone notices
# observability science: find unknown unknowns
# traditional backend: find known knowns faster
WHY THIS MATTERS
OpenTelemetry solved the open instrumentation and transport problem. Your backend solved the storage and search problem. Neither was designed for the question that matters most right now: what did the AI-generated code in the last deploy actually do? Dstl8 is the distillation and signal layer that answers that question, sitting alongside what you already have.
The solution
How Engineering Teams Get Signal from OTLP Logs Without Replacing Anything.
Fan your OTLP logs to Dstl8. Keep your existing backend exactly as it is. Möbius reads the distilled signal — pattern clusters, anomalies, ranked incidents — and answers questions from Claude Code, Cursor, or your terminal. Nothing to rip out.
One more OTLP exporter, nothing to rip out
Dstl8 accepts OTLP logs natively. Add a Dstl8 exporter alongside your existing one and fan your log stream out. Your Loki, Datadog, or SigNoz setup stays exactly as it is, as the system of record for search and retention.
Distillation in front of Möbius, not raw logs
Dstl8 doesn’t just index logs — it clusters by pattern, scores sentiment, tracks severity and volume over time, and flags anomalies against each service’s baseline. Möbius reads that distilled signal and surfaces what’s new or worth attention, ranked by impact.
Pattern-emergence detection for the AI SDLC cadence
“What’s new since the last deploy” is the default question Dstl8 is built around. When Claude Code ships a change, Dstl8 sees the pattern emerge in staging or prod before your on-call does.
DEBUG noise collapses into clustered signal via MCP
The AI agent that wrote the code can ask Dstl8 what the code just did. Grounded in live OTLP logs, answered in the editor, no tab-switching.
Query incidents from Claude Code, Cursor, or your terminal
Leave DEBUG on where it’s useful. Dstl8 clusters repeated patterns into single events, so a 10,000-line storm becomes one row you can ignore — and Möbius surfaces the anomalous DEBUG spike because it’s anomalous, not because a threshold fired.
EXAMPLE OTel INCIDents
What you get
How Teams Distill OTLP Signal Without Replacing Their Backend.
MÖBIUS
Distilled signal, with receipts.
COMPLEMENT
Keep your backend. Add the signal layer.
UNKNOWN UNKNOWNS
Find what you didn’t know to alert on.
AI SDLC
Built for the deploy cadence AI tools create.
DEBUG
Leave DEBUG on where it’s useful.
Get Started
Terminal-native OTLP receiver before you commit to a bigger workflow.
Complement, not replace
OpenTelemetry Log Analysis: Where Dstl8 Fits Alongside Your Backend.
Capability
Store and search OTLP logs
Long-term retention and compliance
Pattern and anomaly detection across services
Proactive “what’s new since the last deploy”
Clustered collapse of high-volume noise
Query incidents from Claude Code / Cursor / terminal
YOUR EXISTING OTEL BACKEND
GENERIC LOG SEARCH
ControlTheory
Common questions
OpenTelemetry Log Analysis — Questions from Engineering Teams.
Get started
Install & Configure Dstl8 in Under 2 Minutes.
Try the Dstl8 CLI and TUI for continuous runtime feedback. Install it, add sources, connect the MCP server into Claude Code, and more.
brew install control-theory/dstl8/dstl8
dstl8 signup
curl -fsSL https://install.dstl8.ai/script/dstl8-cli | shnpx dstl8nix run github:control-theory/dstl8Download from https://github.com/control-theory/dstl8/releasesQuick Start
# 1. Install the CLI
brew install control-theory/dstl8/dstl8

# 2. Create a Dstl8 account (or `dstl8 login` if you already have one)
dstl8 signup

# 3. Add a source so logs flow in
dstl8 sources add vercel

# 4. Connect your AI agent, auto-detects MCP-compatible clients on your machine and configures them
dstl8 install --all
dstl8 install claude-code
Add Sources
# Add Sources

dstl8 sources add kubernetes
dstl8 sources add cloudwatch
dstl8 sources add vercel
dstl8 sources add supabase
dstl8 sources add otlp
dstl8 sources add github
Start Here

See what’s actually happening.
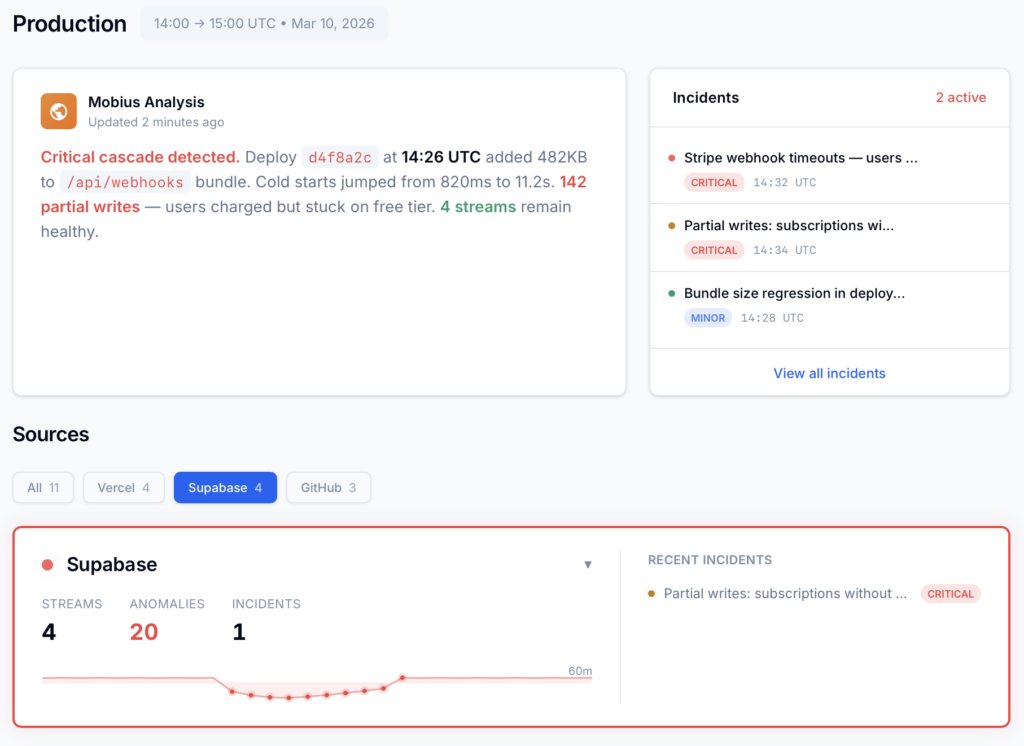
Connect your deployment chain. Surface emergent patterns. Get root cause analysis with fix recommendations — right in your editor.
↻ Intelligence that compounds — every runtime signal makes the next one sharper.
Dstl8 — Supabase runtime analysis

Open Source
Not ready for Dstl8? Start with Gonzo.
Free, open source log analysis TUI. Real-time charts, pattern detection, AI-powered insights — right in your terminal. No account, no config.
brew install gonzo
Your OTel backend stores the logs. Dstl8 distills the signal.
Free account. One OTLP exporter to add, nothing to rip out. Möbius reads your distilled log stream so you don’t have to. Early access to Dstl8 — no credit card, no sales call.
Related pages
More for AI Code Generation Reliability.
Keep Your OTel Backend.
Add the Signal Layer.
Fan your OTLP logs to Dstl8 and let Möbius surface the pattern changes your dashboard can’t see. Query from Claude Code, Cursor, or your terminal. Nothing to rip out.