


Platform Observability · Railway
Railway Deploys Fast. Now Debug It Fast.
Railway ships your app in seconds. When something breaks in production, the logs are scattered, the 500-line-per-second cap is silent, and the dashboard wasn’t built for debugging. Dstl8 gives you a real log analysis tool for Railway and your full runtime surface — in under 2 minutes.
brew install control-theory/dstl8/dstl8
500 lines/sec
Hard cap on Railway log ingestion — dropped lines unrecoverable
3 tabs
Deployment, build, and observability logs — no unified debugging view
2 min
Time to first insight with DSTL8
Zero
Log-based alerting on Railway error patterns
Zero
Toil. Max signal.
Six failure modes
Six Ways Railway Logging Breaks Down in Production.
Railway is built for speed. Its observability layer was built for visibility, not for active debugging. These are the six structural gaps that show up when something breaks in production and you need to understand what happened.
01
Logs scattered across three tabs with no unified view
Railway splits your log stream across Deployment logs, Build logs, and the Observability tab. The Log Explorer in the Observability tab does provide a cross-service view with filter syntax — but it’s a query tool, not a debugging interface. Deployment-specific and build-specific logs still live in separate panels. When a production incident starts, you’re switching between contexts to correlate build output with runtime behavior, and the Log Explorer’s search and filtering weren’t designed for the kind of rapid, iterative investigation that active debugging requires.
scattered logs — no unified view
# where is the error?
[Deployment tab] app crashed · exit code 1
[Build tab] pip install succeeded · image built
[Observability] request latency spike · 2s avg
# which log is relevant? unknown
# Cross-tab search: Log Explorer exists, but not built for debugging
# time to correlate: manual
02
The 500 line/sec cap drops logs silently — worst during the moments that matter most
Railway’s log ingestion has a hard cap of 500 lines per second. When traffic spikes, when a retry loop fires, when an error cascade starts — that’s exactly when your application produces the most log volume. That’s also exactly when Railway starts dropping lines. You get a warning message in the log stream with an approximate count of dropped lines — but no gap marker, no record of which specific lines were lost, and no way to recover them. During an incident, you’re debugging with incomplete data and no way to know what’s missing.
500 line/sec cap — silent drop
[23:41:02] ERROR payment_webhook · retry attempt 1
[23:41:02] ERROR payment_webhook · retry attempt 2
[23:41:02] ERROR payment_webhook · retry attempt 3
…
[23:41:03] INFO cache warm ← log stream resumes here
# lines dropped: ~44 (approximate, per warning message)
# which lines: unknown — no gap markers
# retries logged: 3 of 47
# root cause: invisible
03
stderr is classified as ERROR — Python, Ruby, and Winston logging break immediately
Railway classifies any output to stderr as severity ERROR, regardless of what the logger actually emitted. Python’s logging module sends INFO, WARNING, DEBUG, and ERROR levels to stderr by default. Winston does the same. Ruby’s standard logger follows the same pattern. The result: every log line your application writes is tagged ERROR in Railway’s dashboard — not because your application is erroring, but because Railway reads the file descriptor, not the log level. Log management best practices rely on accurate severity. Railway’s stderr override makes severity meaningless.
stderr = error — every log level mislabeled
# your python logger
import logging
logging.basicConfig(level=logging.INFO)
logger = logging.getLogger(name)
logger.info(“Server started on port 8080”) → Railway: ERROR
logger.warning(“Cache miss rate elevated”) → Railway: ERROR
logger.error(“Database connection failed”) → Railway: ERROR
# actual error rate: 1 of 3
# railway error rate: 3 of 3
04
No native alerting — error spikes in production go unnoticed until a user reports them
Railway has no log-based alerting. No way to fire a notification when error logs show an anomalous pattern. No way to be paged when a specific pattern appears in your log stream. If your application starts throwing unhandled exceptions at 2am, you find out when a user files a ticket or a Slack message arrives from someone checking manually. Log analysis without alerting is archaeology — you’re studying what already happened, not stopping what’s happening now.
no native alerting — error spike undetected
02:17 ERROR unhandled exception · users/:id/payment
02:18 ERROR unhandled exception · users/:id/payment
02:19 ERROR unhandled exception · users/:id/payment
…
07:43 Support ticket filed: “payments broken since last night”
# time to detection: 5 hours 26 minutes
# cause: unchanged
# alert fired: none
05
No first-party log drain — exporting Railway logs requires deploying a sidecar
Railway does not support a native log drain. To get your logs into an external system — a log management platform, a SIEM, a long-term log file store — you have to deploy Locomotive, a separate sidecar container that intercepts the log stream. That’s an additional service to deploy, configure, monitor, and maintain. Log export shouldn’t require a parallel infrastructure investment. Railway’s own documentation acknowledges this limitation and points to the community-built workaround.
no native log drain — sidecar required
# to export railway logs to any external system:
1. Deploy Locomotive sidecar to Railway
2. Configure OTLP endpoint in Locomotive
3. Connect Locomotive to your observability platform
4. Monitor Locomotive for its own failures
5. Pay for an additional Railway service
# native log drain: not available
# drain config: not available
# lines of config: many, for a workaround
06
The dashboard log viewer wasn’t built for debugging
Railway’s log viewer in the dashboard has a set of well-documented UX problems: log output from multiple processes is interleaved without clear source labels, the scroll position resets unexpectedly, context links inside log entries don’t resolve correctly, and search breaks on special characters common in stack traces — parentheses, brackets, colons. These aren’t edge cases. They’re the characters that appear in every Python exception, every JSON log line, and every Docker error message. The log explorer is built for visibility, not investigation. When you’re debugging a production error, you need a log analysis tool, not a deployment dashboard with logs bolted on.
dashboard log viewer — search broken on special characters
# searching for a stack trace in railway log explorer
Query: File “/app/services/payments.py”, line 47
Result: 0 matches
# special characters in query break the search parser
# actual matches in log stream: 23
Query: payments line 47
Result: 847 matches, unsorted, interleaved across services
Why this matters
Railway’s observability layer is improving — the team shipped logs, metrics, and traces in a single release and continues to iterate. But the current architecture was designed around deployment visibility, not active debugging. The gaps above aren’t oversights. They’re the cost of a platform that prioritizes shipping speed over observability depth. That’s the right tradeoff for Railway to make. It means teams that deploy on Railway need a real log analysis tool alongside it — not instead of it.
The solution
How Railway Teams Debug Production Problems Fast.
The six failure modes above are structural — they don’t disappear with a Railway update. What changes is how fast you find signal in the noise, surface the error that matters, and fix it before a second user is affected.
One view across all Railway log types
Deployment logs, build output, and runtime errors — unified in a single stream, filterable by severity, searchable without special-character restrictions. You stop tab-switching and start debugging.
Pattern analysis that works even when Railway drops lines
The 500 line/sec cap is a hard constraint you can’t change. Structured log distillation means you get the signal from the lines that made it through — even during a high-volume incident when Railway’s ingestion is dropping the tail of your error cascade.
Actual log severity — not Railway’s stderr override
Dstl8 reads the structured log output your Python logger, Winston logger, or Ruby logger actually emits. INFO is INFO. WARNING is WARNING. ERROR is ERROR. You stop treating every line as a false alert and start seeing what’s real.
Continuous monitoring with automated root cause analysis
No native Railway alerting means you need a layer that watches the log stream on your behalf. Mobius monitors continuously, detects anomalous patterns, and surfaces a diagnosis — description, evidence, and a prioritized action list — before you go looking.
Direct CLI-to-Gonzo streaming — no sidecar required
Pipe your Railway CLI log output directly into Gonzo. No Locomotive deployment, no OTLP configuration, no extra Railway service to manage. For teams that need structured log export into Dstl8, OTLP-native ingestion is available at the pro tier.
A terminal-native log viewer built for debugging, not dashboards
No scroll resets. No interleaved output without source labels. No search that breaks on colons. Dstl8 is purpose-built for the moment when something is broken in production and you need to read a log stream fast.
What you get
How Railway Teams Catch Production Failures Before They Scale.
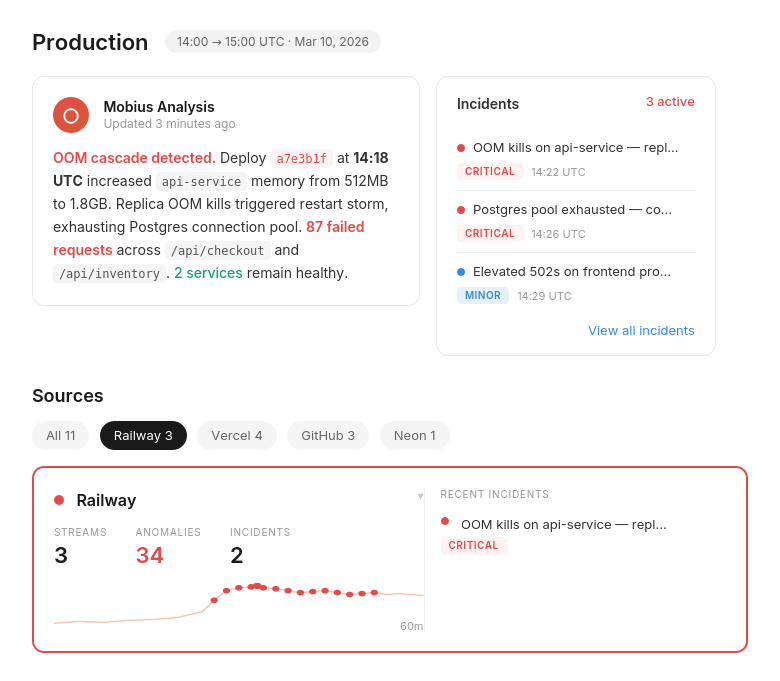
Active Incidents
See what’s breaking across your Railway services — before a user files a ticket.
Every active incident, ranked by severity, with timestamps and source. Not a log dump — a prioritized list of what needs attention right now. Deployment errors, runtime exceptions, and latency spikes in one view.
Railway at Scale
The log visibility gap that grows with your deployment.
500 lines/sec cap · silent drop
The faster your Railway app grows, the more log volume it produces during incidents. The 500 line/sec cap doesn’t scale with your traffic. The gap between what happened and what you can see widens exactly when you need it to close.
Incident Detail
Not just what broke. What caused it, and exactly what to do.
Dstl8 surfaces a diagnosis and suggests the fix — description of what’s happening, evidence with specific data points from your log stream, and a numbered action list. You’re reviewing a recommendation, not starting an investigation in three separate Railway tabs.
Mobius
Ask it anything about your Railway log stream.
Natural language. Real answers from your actual Railway deployment data — not documentation. Mobius distills your log streams continuously, detects what’s anomalous, and tells you what to do next. Structured log analysis without the manual work.
Get Started
Start with Gonzo — free, open source, 2 minutes.
brew install gonzo
Terminal-native log analysis tool. No config, no account, no agent. Pipe your railway logs output directly into Gonzo and you’re reading your production log stream before the next deploy.
Railway log analysis — your options
Debugging Railway Logs: What You’re Working With.
Capability
Unified view across deployment, build, and observability logs
Accurate log severity (Python/Ruby/Winston)
Log analysis during high-volume drops
Production alerting on log error patterns
Log export without sidecar deployment
Diagnosis with suggested actions
Time to first insight
Manual (Railway Dashboard)
Railway + Third-Party Logging
ControlTheory
Common questions
Railway Log Analysis — Questions from Engineering Teams.
Get started
Install & Configure Dstl8 in Under 2 Minutes.
Try the Dstl8 CLI and TUI for continuous runtime feedback. Install it, add sources, connect the MCP server into Claude Code, and more.
brew install control-theory/dstl8/dstl8
dstl8 signup
curl -fsSL https://install.dstl8.ai/script/dstl8-cli | shnpx dstl8nix run github:control-theory/dstl8Download from https://github.com/control-theory/dstl8/releasesQuick Start
# 1. Install the CLI
brew install control-theory/dstl8/dstl8

# 2. Create a Dstl8 account (or `dstl8 login` if you already have one)
dstl8 signup

# 3. Add a source so logs flow in
dstl8 sources add vercel

# 4. Connect your AI agent, auto-detects MCP-compatible clients on your machine and configures them
dstl8 install --all
dstl8 install claude-code
Add Sources
# Add Sources

dstl8 sources add kubernetes
dstl8 sources add cloudwatch
dstl8 sources add vercel
dstl8 sources add supabase
dstl8 sources add otlp
dstl8 sources add github
Start Here
See what’s actually happening.
Connect your deployment chain. Surface emergent patterns. Get root cause analysis with fix recommendations — right in your editor.
↻ Intelligence that compounds — every runtime signal makes the next one sharper.
Dstl8 — Supabase runtime analysis


Open Source
Not ready for Dstl8? Start with Gonzo.
Free, open source log analysis TUI. Real-time charts, pattern detection, AI-powered insights — right in your terminal. No account, no config.
brew install gonzo
Railway deploys fast. Now debug it fast.
Free account. Gonzo running against your Railway log stream in 2 minutes. Early access to Dstl8. No credit card, no sales call.
Related pages
More for the Vibe Stack.
Railway deploys fast.
Now debug it fast.
Free, open source, terminal-native. Real log analysis for Railway in 2 minutes. No account, no config.