


GitHub Actions · Workflow Runs · Post-Deploy Regression · MCP
GitHub Actions Reliability — Dstl8 Catches the Regression Your Last Deploy Caused.
AI writes the code. Actions runs CI. Actions runs the deploy. When prod breaks five minutes later, you’re scrolling 200 log lines across 14 jobs in the Actions UI trying to figure out which commit did it.
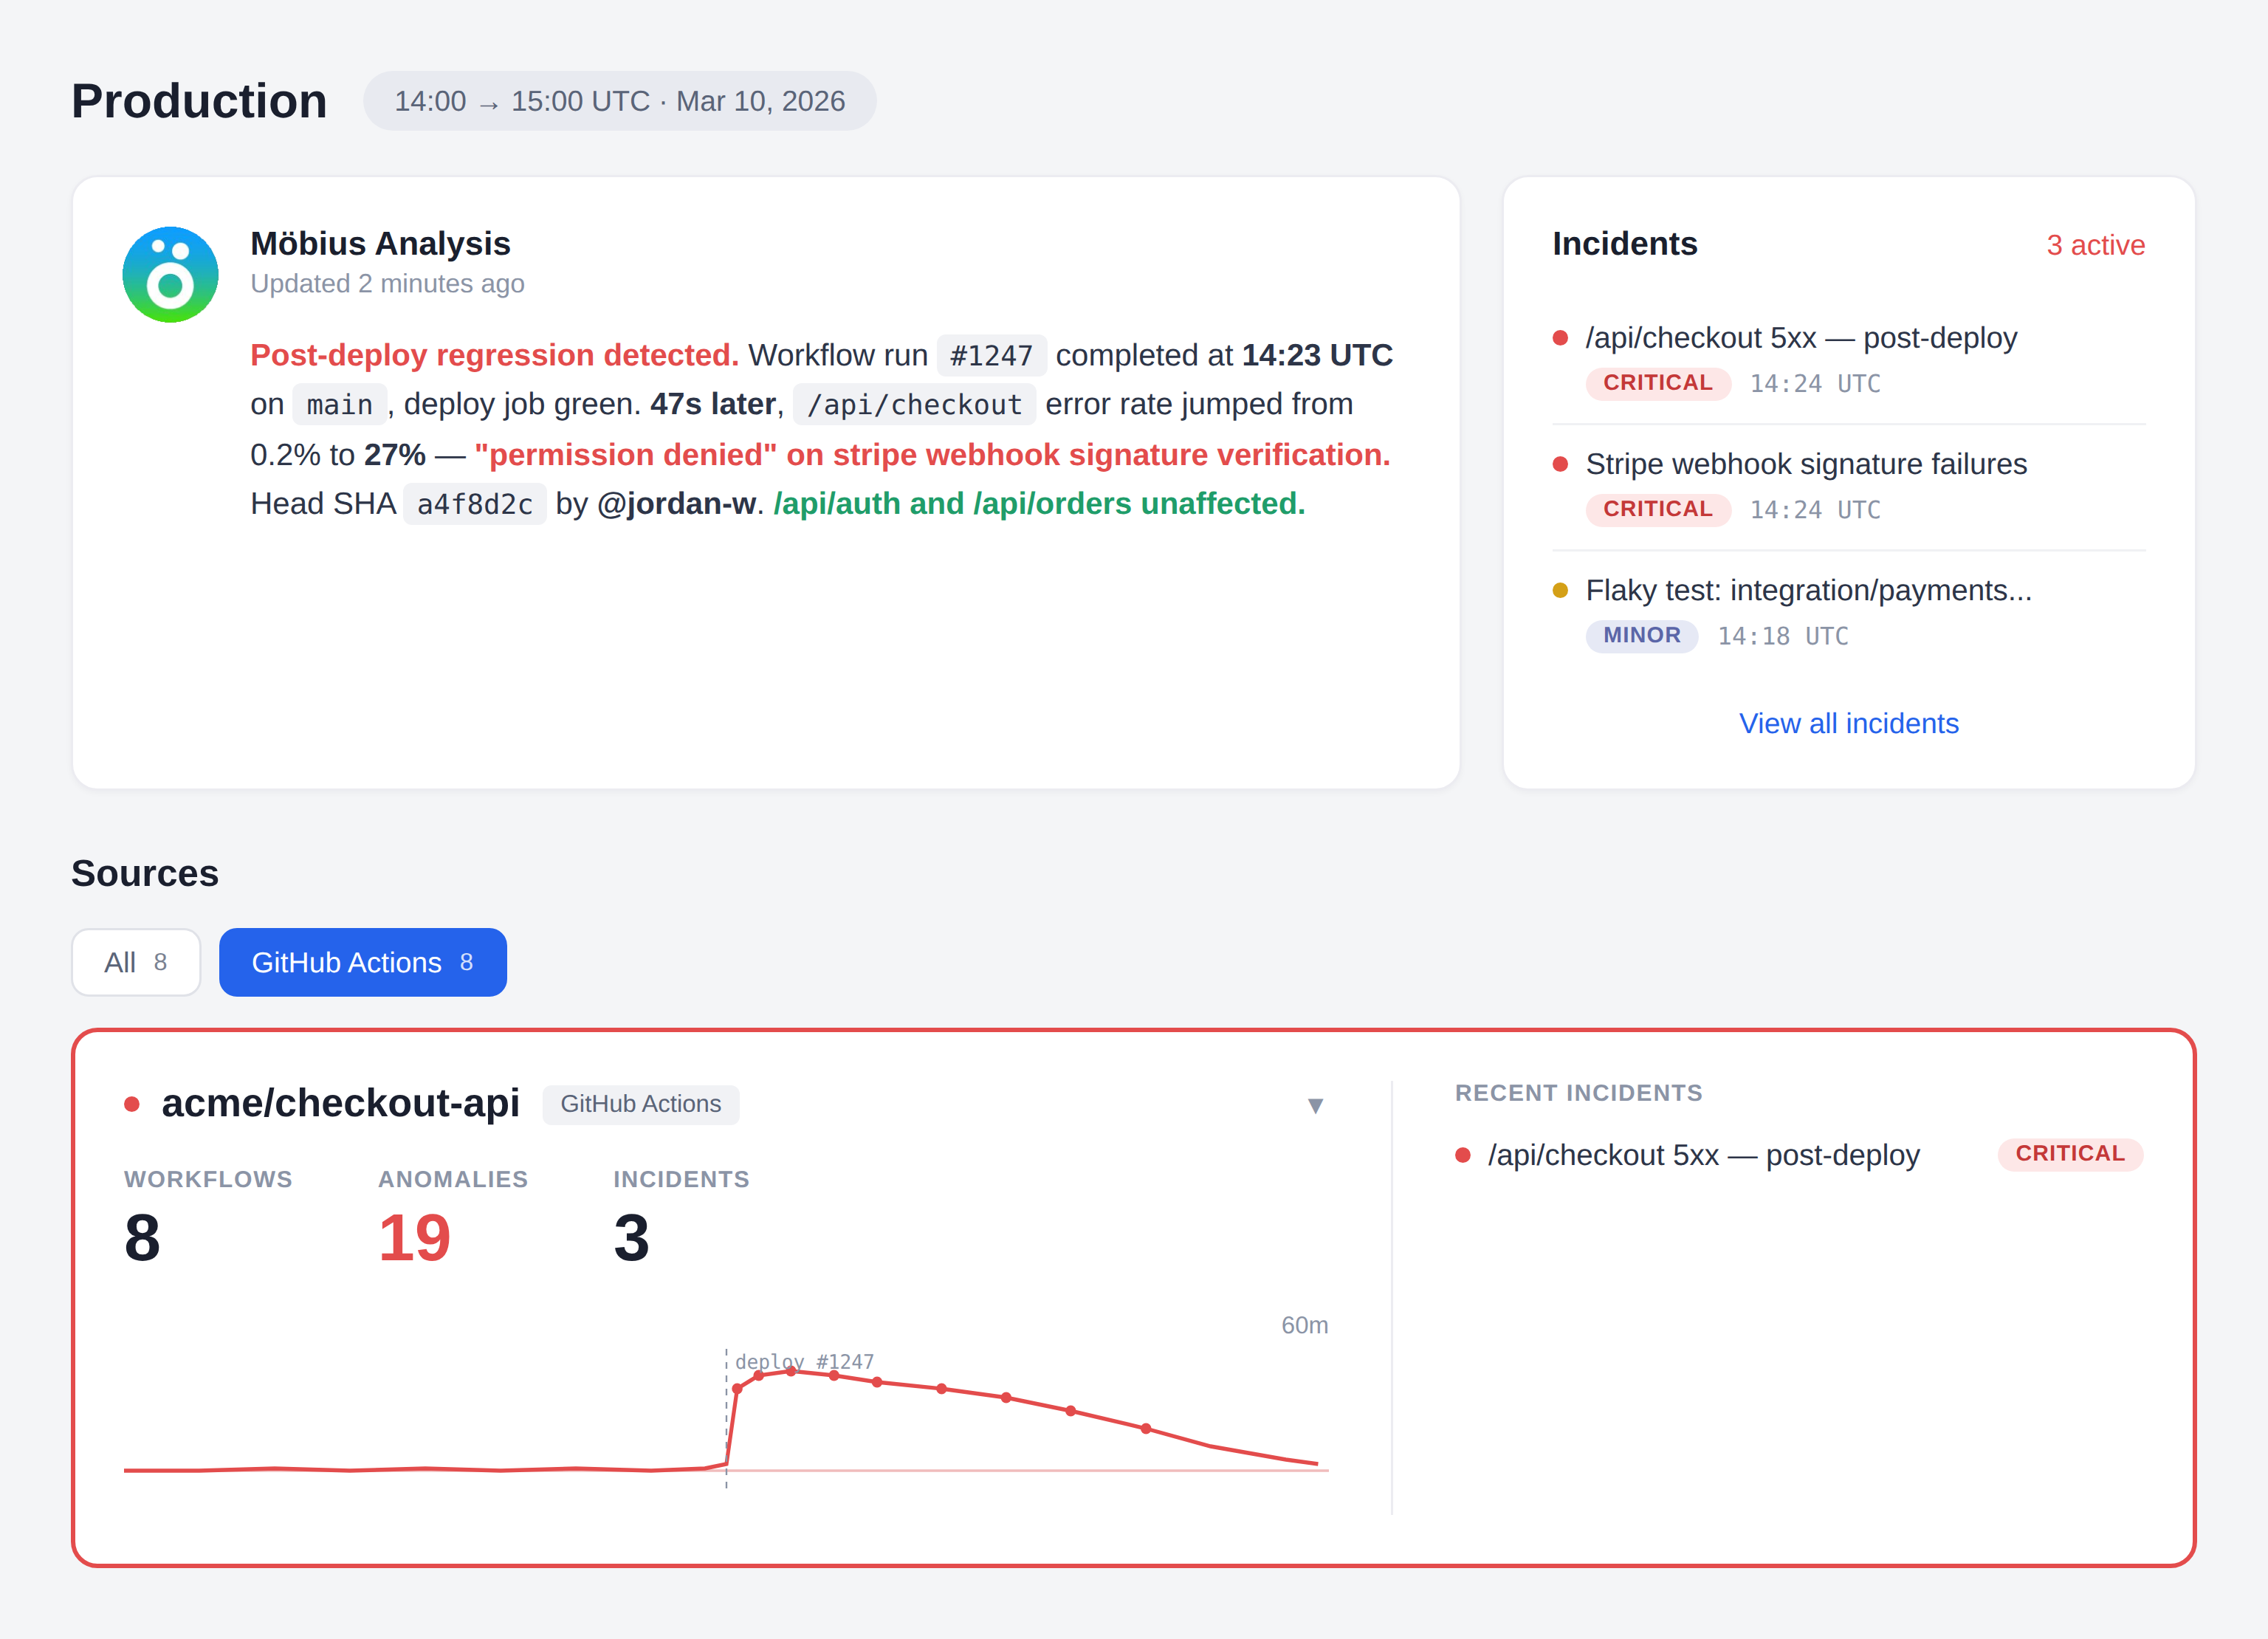
Add the Dstl8 GitHub source as a webhook in your repo, and Möbius correlates the production error spike to the deploy job that caused it, names the commit and author, and Claude Code closes the loop through GitHub MCP — read the diff, write the patch, open the PR. The next workflow run is the verification.
7.2%
DROP IN DELIVERY STABILITY PER 25% INCREASE IN AI ADOPTION (2025 DORA REPORT)
1–2 hr
TYPICAL POST-DEPLOY REGRESSION TRIAGE BY HAND
~10 min
SAME LOOP WITH MÖBIUS DETECTION AND AN MCP-DRIVEN FIX PR
2 min
TO ADD THE DSTL8 GITHUB WEBHOOK TO YOUR REPO
2
MCP SERVERS, ONE FIX LOOP (DSTL8 + GITHUB)
FIVE FAILURE MODES
Five Reasons Post-Deploy Regressions Stay Hidden in GitHub Actions.
GitHub Actions has logs. The incident path does not. A real production failure usually started with a deploy that just shipped, and the evidence lives in two places at once — the workflow_run that ran the deploy, and the application logs from production. Actions doesn’t connect them. These are the structural reasons time-to-answer stays long.
01
The deploy succeeded, the error spiked, you’re the join
The workflow run finished green. The deploy job inside it completed. Forty-seven seconds later, /api/checkout started erroring. Two timestamps, two surfaces, no tool stitching them together. You’re the correlation engine.
# Actions tells you
workflow_run #1247 conclusion: success completed_at: 14:23:11
deploy job conclusion: success completed_at: 14:23:09
# your app tells you
14:23:56 ERROR /api/checkout permission denied
14:23:57 ERROR /api/checkout permission denied
14:23:58 ERROR /api/checkout permission denied
# the gap: nothing is correlating these two facts
02
The run / job / step hierarchy puts the actual failure three clicks deep
A workflow run contains jobs. Jobs contain steps. Steps contain log lines. The error is at the bottom of that tree and the only path to it is clicking. Multiply by every investigation this week.
workflow_run #1247
└─ build 14 steps ✓
└─ test 22 steps ✓
└─ integration 31 steps ✗ ← three more clicks to find the line
└─ deploy 18 steps ✓
# the line that matters is not on the page you started on
03
“Re-run failed jobs” hides flakes and structural fragility
The fastest way to make red CI green is the button labelled “Re-run failed jobs.” It works. The structural problem that caused the failure does not announce itself a second time. The pattern across runs goes with the red X.
# pre-rerun
test job conclusion: failure step 14 timed out
# post-rerun
test job conclusion: success
# what changed → nothing
# what we learned → nothing
04
AI writes the code, runs CI, deploys. No human in the loop until prod breaks.
Claude Code wrote the change. Claude Code wrote the test. CI passed. Auto-merge fired. Actions deployed. Everything green. Then production started erroring. The first human in the loop is the on-call engineer reading a Slack alert with no context on what shipped or why.
agent opened PR
agent’s tests passed
agent merged
agent deployed
prod broke
human paged
# every step before the page was automated
# the context for “what just shipped?” is not
05
“Shotgun-into-LLM” CI debug tools miss the post-deploy correlation entirely
Some AI observability tools pipe raw CI logs into a language model and let it guess. Without correlation to production errors and attribution from the workflow_run payload, the answer is generic. The actual incident — a prod regression caused by the deploy that just finished — is invisible to a tool that only reads CI logs.
ci logs only → LLM → “your test failed, here’s a generic fix”
no prod correlation → misses the actual incident
no commit attribution → can’t name the author
no event payload → no head SHA, no branch, no actor
# vague RCAs, no fix loop
Why this matters
GitHub Actions does not fail because it lacks logs. The data is structured, the events are clean, the attribution is in the payload. It fails as a debugging surface because the run/job/step tree, the production runtime, and the developer in the editor are three different worlds. The bottleneck is correlation, attribution, and the round-trip from “what broke” to “PR opened with a fix.” Raw log availability is not the bottleneck. Distillation, attribution, and an MCP-driven fix loop are.
THE SOLUTION — DETECT, ATTRIBUTE, FIX
How GitHub Actions Teams Close the Loop From Red Build to Merged Fix.
Dstl8 sits alongside the Actions UI you already use. Workflow events flow into the same distillation pipeline as your application logs. Möbius reads the correlated signal and Claude Code closes the loop — Dstl8 MCP for investigation, GitHub MCP for action.
1. DETECT → Möbius watches workflow_run, workflow_job, and
application logs as one continuous stream
2. ATTRIBUTE → Temporal correlation + head commit SHA, author,
branch, and triggering actor from the event payload
3. FIX → Dstl8 MCP investigates. GitHub MCP acts. Claude
Code reads the diff, writes the patch, opens the PR.
The next workflow_run is the verification.
Möbius reads workflow events and app logs as one stream
Dstl8’s GitHub source ingests Workflow runs and Workflow jobs from GitHub Actions into the same distillation pipeline as your production application logs. CI failures and post-deploy regressions show up the same way — a Slack alert with the cause already drafted and the evidence already cited.
Post-deploy regression correlation, with named commit and author
When app errors spike shortly after a workflow run completes on main, Möbius identifies the temporal correlation and attributes it to the head commit, branch, and author straight from the workflow_run payload. The alert says which deploy did it, not “something is wrong somewhere.”
Möbius reads distilled signal, not raw CI logs
The shortcut approach — shotgunning CI output to an LLM — produces vague RCAs disconnected from production. Dstl8 distills CI events and application logs first, correlates them by time and route, and surfaces ranked incidents with cited evidence. Token spend is bounded by incident volume, not log volume.
Two-minute webhook setup, no infrastructure to deploy
Create a Dstl8 GitHub source, copy the Payload URL and Secret into your GitHub repo’s webhook settings, check the boxes for Workflow runs and Workflow jobs. That’s the whole setup. No collector to run, no workflow YAML changes, no runner changes, no code changes. Workflow events start flowing into Dstl8 immediately.
Close the loop through Dstl8 MCP + GitHub MCP
Dstl8 MCP is the observation layer — it answers questions about incidents, patterns, log evidence, and attribution. GitHub MCP is the action layer — it reads diffs, writes commits, opens PRs. Claude Code uses both in sequence: Dstl8 MCP to investigate, GitHub MCP to act. Two MCP servers, one fix loop, one human approval.
What you get
How Möbius Turns Workflow Events Into a Fix PR.
MÖBIUS
Möbius reads distilled signal. Not raw CI logs.
The shortcut approach — shotgunning workflow output to an LLM — produces vague “your test failed, here’s a generic fix” answers disconnected from production. Dstl8 runs distillation first — pattern clustering across runs, temporal correlation between workflow events and app logs, and attribution from the workflow_run payload. Möbius reads that signal and surfaces ranked incidents only, with every claim linked to the specific event, log line, or commit that produced it.
Post-Deploy Correlation
Catch the regression your last deploy just caused.
~47s typical lag from deploy completion to first prod error
Möbius watches workflow_run completions on main and correlates them against application error patterns in the minutes that follow. When a deploy job finishes and a route-specific error spike starts seconds later, Dstl8 surfaces the temporal link, names the head commit and author from the workflow_run payload, and tells you which deploy did it. The signal is automatic; the attribution comes straight from the event.
Fix Loop
Detect, attribute, fix, verify — without leaving the editor.
2 MCP servers, one fix loop
Möbius detects the regression and posts the alert. Claude Code asks Dstl8 MCP for the correlated context — failing route, error pattern, commit SHA, author. Claude Code asks GitHub MCP for the diff at that SHA, writes the patch, opens a PR. The PR triggers a new workflow run. Möbius watches that run and the post-deploy error pattern. The loop closes when the new run completes clean and the error pattern stops.
COMPLEMENT
Keep your CI. Add the signal layer.
2 min webhook setup
Dstl8 doesn’t replace GitHub Actions or your existing CI. The Dstl8 GitHub source installs as a webhook in your repository — paste the Payload URL and Secret, check Workflow runs and Workflow jobs, done. Workflow events flow into Dstl8’s distillation pipeline alongside your production application logs. No infrastructure to run, no workflow YAML changes, no runner changes, no code changes.
CI-TO-PROD CORRELATION
One incident view for CI failures and production errors.
Two surfaces, one stream. A failing test in CI and a 5xx spike on /api/checkout no longer live in different tools. Möbius sees both, ranks them by impact, and tells you when they’re connected. The on-call engineer doesn’t need to know which tab to open first.
Gonzo
Terminal-native log analysis before you commit to a bigger workflow.
2 min to first usable stream
Gonzo is the open-source terminal log TUI from the team behind Dstl8. Tail any structured log stream from your terminal — application logs, OTLP receivers, cloud platform logs — with pattern detection, severity heatmaps, filters, and on-demand AI summarization. Useful by itself for active debugging anywhere logs flow. Bring in Dstl8 when you want continuous coverage of your GitHub Actions workflow events, post-deploy correlation, and the in-editor fix-loop work.
Comparison framing
Debugging GitHub Actions Reliability: Your Options.
Capability
Inspect workflow run logs
Cross-run pattern and flake detection
Post-deploy regression correlation with prod errors
Commit and author attribution from workflow_run payload
Distillation + correlation before AI analysis
Grounded incident narratives with cited evidence
Bounded LLM token cost regardless of log volume
Fix PR opened from inside the editor via MCP
GITHUB ACTIONS UI
“AI SRE” BLACK BOXES
ControlTheory
Common questions
GitHub Actions + AI Code Generation — Questions From Engineering Teams.
Get started
Install & Configure Dstl8 in Under 2 Minutes.
Try the Dstl8 CLI and TUI for continuous runtime feedback. Install it, add sources, connect the MCP server into Claude Code, and more.
brew install control-theory/dstl8/dstl8
dstl8 signup
curl -fsSL https://install.dstl8.ai/script/dstl8-cli | shnpx dstl8nix run github:control-theory/dstl8Download from https://github.com/control-theory/dstl8/releasesQuick Start
# 1. Install the CLI
brew install control-theory/dstl8/dstl8

# 2. Create a Dstl8 account (or `dstl8 login` if you already have one)
dstl8 signup

# 3. Add a source so logs flow in
dstl8 sources add vercel

# 4. Connect your AI agent, auto-detects MCP-compatible clients on your machine and configures them
dstl8 install --all
dstl8 install claude-code
Add Sources
# Add Sources

dstl8 sources add kubernetes
dstl8 sources add cloudwatch
dstl8 sources add vercel
dstl8 sources add supabase
dstl8 sources add otlp
dstl8 sources add github
Start Here
See what’s actually happening.
Connect your deployment chain. Surface emergent patterns. Get root cause analysis with fix recommendations — right in your editor.
↻ Intelligence that compounds — every runtime signal makes the next one sharper.
Dstl8 — Supabase runtime analysis


Open Source
Not ready for Dstl8? Start with Gonzo.
Free, open source log analysis TUI. Real-time charts, pattern detection, AI-powered insights — right in your terminal. No account, no config.
brew install gonzo
Stop Scrolling Run Logs. Let Möbius Find It.
Add the Dstl8 GitHub source as a webhook in your repo. Let Möbius detect the post-deploy regression, attribute it to the commit and author, and hand the loop to Claude Code via MCP. Detection, attribution, fix PR, and verification — one stream, two MCP servers, one human approval.
Related pages
More for AI code generation reliability.
Workflow Runs Tell You What Ran.
Möbius Tells You What Broke.
Two MCP servers. One fix loop. From Slack alert to merged PR without leaving the editor. Free, webhook-only setup, 2 minutes to first signal.