


Use Case · Fix Issues Across Your Deployment Chain
Fix Issues Across Your Deployment Chain. Without Touching a Log or Metric.
Your vibe stack got you to product. For some jobs, you reached for AWS. Lambda for async work, Fargate for long-running, SQS for queueing, AWS CloudWatch for the logs that came with them. Now you are running Vercel and Supabase alongside AWS primitives, and the failures live at the joins. Dstl8 reads the whole chain as one system. Its Möbius agent names the layer that broke, cites the evidence, and points at the fix. No dashboard archaeology.
brew install control-theory/dstl8/dstl8
11
Platforms integrated
Cross-layer
Correlation, not cross-tool
Cited
Evidence behind every claim
0
Dashboards to stitch together
What changed
Your stack got bigger. The tools still see one layer at a time.
Your vibe stack got you to product. At some point a few jobs needed more than PaaS was built for: async work that could not run in a function, queues, long-running processes, blob storage, AI inference. You reached for AWS primitives. Each piece solved a problem. Together they made a new one: your stack is now two stacks stitched together, and the failures live at the stitches.
Your chain is not a stack you can grep. It is a system that needs to be read.
TLDR
You did not want to run infrastructure. You wanted to ship. Dstl8 reads your chain so you can keep doing that.
How Dstl8 works
Four parts of Dstl8 that make this work.
This use case sits on top of Dstl8’s core capabilities. Each card below links to its full capability page for the deep dive.
01
Every layer, one continuously distilled state.
Dstl8 ingests Lambda logs, ECS and Fargate task output, and SQS signal via AWS CloudWatch, plus Supabase logs, Vercel runtime logs, and more, all into one continuously distilled runtime state. Its Möbius agent reasons on that state as one system, not four dashboards and a Stripe tab.
# what streams in
lambda · fargate · sqs · cloudwatch · vercel · supabase · stripe
# what comes out
one distilled chain · continuously current
02
Möbius agent reasons on the whole chain, not the layer.
When something breaks at a seam, Dstl8’s Möbius agent reasons over the full chain: where the request entered, which layers handled it, what changed, where the anomaly lives. It reasons on the patterns, samples, and anomalies Dstl8 distilled from every connected layer. The diagnosis names the layer that broke and the interaction that caused it, with cited evidence.
# möbius reasons over
patterns · samples · anomalies · cross-layer correlation
# möbius returns
layer + interaction + evidence + suggested fix
03
11 platforms, your mix, one system view.
Vercel, Supabase, Railway, AWS CloudWatch (Lambda, ECS, Fargate), Kubernetes, OpenTelemetry, Netlify, Render, Fly.io, Cloudflare Workers, plus Gonzo forwarding for local dev. Half PaaS, half AWS, some of each — Dstl8 reads your chain as one chain because that is what it is.
04
Deploy-aware correlation ties change to behavior.
Connect GitHub and Dstl8 sees your deploy events: which service shipped, when, what changed. Its Möbius agent correlates those events against the runtime behavior that follows. If the new Lambda handler and the unchanged Fargate consumer start disagreeing forty minutes after a push, the agent connects the deploy to the shift. You find out that the contract changed, not just that something broke.
TLDR
Your chain is one system. Dstl8 reads it that way, so you do not have to.
Real world use case
The deploy was green. Forty minutes later, it wasn’t.
An example scenario every team running a hybrid vibe + AWS stack has hit. A rollout goes through. Every individual layer reports success. The integrated behavior starts failing without tripping a single dashboard.
Without Dstl8.
You deploy a new Lambda handler for Stripe webhooks. The handler writes to Supabase through a Fargate worker that drains an SQS queue. Deploy goes green. Lambda shows 200s in AWS CloudWatch. SQS depth looks normal. Fargate task is healthy. Supabase writes are happening. Forty minutes in, a subset of payment events stops reconciling. Not all of them, just the ones that match a particular Stripe event type. You open AWS CloudWatch for Lambda, AWS CloudWatch for Fargate (different log group), the Supabase logs tab, and the Stripe dashboard. Four tools. No single view of “this request came in, this is where it ended up.” The SQS dead letter queue has been silently filling up for an hour. Three hours of cross-referencing timestamps before you find the real cause.
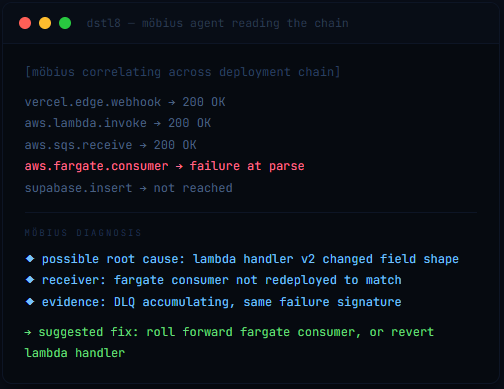
With Dstl8.
The Möbius agent already correlated the deploy event against the runtime shift. (GitHub integration surfaced the v2.4.0 ship; Dstl8 watched what happened next.) The diagnosis names the Lambda handler as the source of the contract change (a field shape in the event payload), the Fargate consumer as the receiver that broke (parsing logic unchanged, now mismatched), and the SQS DLQ as the place the evidence is piling up. Fix suggested with options: roll forward the Fargate consumer to match, or revert the Lambda handler. Fifteen minutes from green deploy to committed fix.

Scenario: deploy verification failure · Runtime surface: Vercel + Lambda + SQS + Fargate + Supabase
Outcome difference: three hours of dashboard-stitching → fifteen minutes of reading Möbius
TLDR
Five layers, one chain, one diagnosis. Not three hours of tab-switching.
Why Dstl8?
The chain as a first-class object, not a collection of dashboards.
One View
Your chain, not four dashboards.
Dstl8 treats your deployment chain as a single object: where the request entered, which layers handled it, where it ended up, what changed, what broke. You are not building a mental model by correlating four tabs by timestamp. The chain is already assembled, continuously, waiting for you to ask.
Cited
Evidence behind every claim.
Möbius does not hand you a hunch. Every layer, every interaction, every root cause links back to the Lambda invocation, the SQS metric, the Fargate log, the Supabase write that supports it.
Your Mix
PaaS plus AWS, not one or the other.
Dstl8 was built for the chain you actually run. Vercel plus Lambda plus Supabase plus Fargate plus SQS is the common case, not the exception. Dstl8 reads your mix.
Deploy-Aware
Change and behavior tied together automatically.
Connect GitHub and Dstl8 correlates your deploy events against the runtime behavior that follows. The “it was fine an hour ago” debugging pattern goes away because the deploy is already in the picture. You find out that v2.4.0 changed a contract, not just that something broke shortly after.
Learn more
Related reading for the platforms in your chain.
The failure modes on this page span five layers. These pages dig into the specific ones, in depth, for the platforms your chain is most likely built on.
Common questions
What teams ask before adopting this.
Get started
Install & Configure Dstl8 in Under 2 Minutes.
Try the Dstl8 CLI and TUI for continuous runtime feedback. Install it, add sources, connect the MCP server into Claude Code, and more.
brew install control-theory/dstl8/dstl8
dstl8 signup
curl -fsSL https://install.dstl8.ai/script/dstl8-cli | shnpx dstl8nix run github:control-theory/dstl8Download from https://github.com/control-theory/dstl8/releasesQuick Start
# 1. Install the CLI
brew install control-theory/dstl8/dstl8

# 2. Create a Dstl8 account (or `dstl8 login` if you already have one)
dstl8 signup

# 3. Add a source so logs flow in
dstl8 sources add vercel

# 4. Connect your AI agent, auto-detects MCP-compatible clients on your machine and configures them
dstl8 install --all
dstl8 install claude-code
Add Sources
# Add Sources

dstl8 sources add kubernetes
dstl8 sources add cloudwatch
dstl8 sources add vercel
dstl8 sources add supabase
dstl8 sources add otlp
dstl8 sources add github
Start Here
See what’s actually happening.
Connect your deployment chain. Surface emergent patterns. Get root cause analysis with fix recommendations — right in your editor.
↻ Intelligence that compounds — every runtime signal makes the next one sharper.
Dstl8 — Supabase runtime analysis


Open Source
Not ready for Dstl8? Start with Gonzo.
Free, open source log analysis TUI. Real-time charts, pattern detection, AI-powered insights — right in your terminal. No account, no config.
brew install gonzo
See Your Chain for What It Is.
Free account. Connect your AWS sources and your PaaS sources. Dstl8 reads them as one chain on the first deploy.
Your chain is one system. Dstl8 sees it that way.
Lambda, Fargate, SQS, Supabase, Vercel, and the rest. Read as one chain, diagnosed as one system, fixed in one pass.