


Lambda · ECS/Fargate · CloudWatch · OpenTelemetry
AWS Serverless Log Analysis —
Möbius Finds the Lambda and Fargate Failures You’d Spend an Hour Looking For.
Serverless ships fast. Debugging does not. A single request crosses Lambda concurrency, Fargate tasks, API Gateway, and queues, and the evidence lands in a dozen log groups. Stop grepping CloudWatch. Dstl8’s AI agent reads the logs, finds the pattern, names the cause, and hands you the fix.
brew install control-theory/dstl8/dstl8
4–8 hrs
TYPICAL MANUAL CORRELATION TIME ACROSS LAMBDAS
15–30 min
SAME INCIDENT WITH AI-LED ANALYSIS
50
LOG GROUP CAP PER CLOUDWATCH INSIGHTS QUERY
1
UNIFIED INCIDENT VIEW INSTEAD OF N LOG GROUPS
2 min
FROM brew install Dstl8 TO FIRST insights
Six failure modes
Six Ways AWS Serverless Debugging Eats Your Afternoon.
CloudWatch has logs. The incident path does not. A real serverless failure spans log groups, concurrent instances, accounts, and services, and CloudWatch asks you to reconstruct all of it manually while the page is still open. These are the structural reasons time-to-answer stays long.
01
You’re the one doing the correlation
A user request touches half a dozen Lambdas and a Fargate task. Each Lambda has its own log group. Each group splits into a log stream per concurrent instance. CloudWatch gives you the raw entries. Stitching them into an incident timeline is manual work.
# CloudWatch shows
/aws/lambda/checkout-api 47 streams
/aws/lambda/webhook-processor 12 streams
/aws/ecs/payment-worker 6 streams
# you want
one timeline for request req-8f507cfc
# the gap: 4-8 hours of grepping
02
CloudWatch Insights runs out of room fast
Teams who commit to Insights run into ceilings mid-incident, and every query scans raw GB for a second bill on data you already paid to ingest.
concurrent queries: 30 max (Standard)
log groups per query: 50 max
records returned: 10,000 max
cross-account: unsupported
cross-region: unsupported
# the incident is bigger than the tool
03
X-Ray doesn’t see the request that failed
X-Ray samples roughly 1 request per second plus 5% of the rest. When your customer hits a single-request failure, the trace almost certainly doesn’t exist. You fall back to logs anyway.
X-Ray coverage: ~5%
single-request failure: 95% chance no trace
next step: back to log groups
04
The CloudWatch UI is not built for active debugging
Page refresh wipes search state. No severity filter in the native view. Log streams split when concurrent instances scale. Export is limited to what’s currently on screen. You lose context exactly when you need it most.
> 47-minute scroll back
> refresh
> state: gone
> stream ended, new stream started
> find the same request: start over
05
OpenTelemetry helps, but the default path taxes cold starts
ADOT layers solve vendor lock-in and come with an auto-instrumentation plus collector plus trace pipeline that adds memory and cold-start overhead on every function. Most teams want that pipeline for tracing, not for logs. If all you need is structured logs shipped somewhere useful, the tax is pure overhead.
+ ADOT layer memory bump
+ auto-instrumentation +100-300ms cold start
+ collector extension must flush before sandbox freeze
# all of that, for log output you already wanted to ship
06
CloudWatch Logs is a per-GB tax on every axis
Ingestion, storage, and query scan all bill per GB. Defaults are indefinite retention on the Standard tier, which is the most expensive path.
Lambda cost: $205 / yr
CloudWatch cost: $10,480 / yr
# same function
# retention: default (indefinite)
# one dev left full payload logging on
WHY THIS MATTERS
AWS serverless does not fail because it lacks logging. It fails in production when one request path crosses Lambda concurrency, Fargate tasks, multiple log groups, and sometimes multiple accounts. The debugging problem is time-to-answer. Raw log availability is not the bottleneck. Intelligent correlation is.
The solution
How AWS Serverless Teams Cut Time-to-Answer From Hours to Minutes.
The goal is not another place to read isolated log streams. The goal is an AI agent that reads the logs for you, correlates across services, names the cause, and tells you where to go next. Möbius does the first hour of triage before you sit down.
Möbius reads logs continuously and surfaces incidents before you open the dashboard
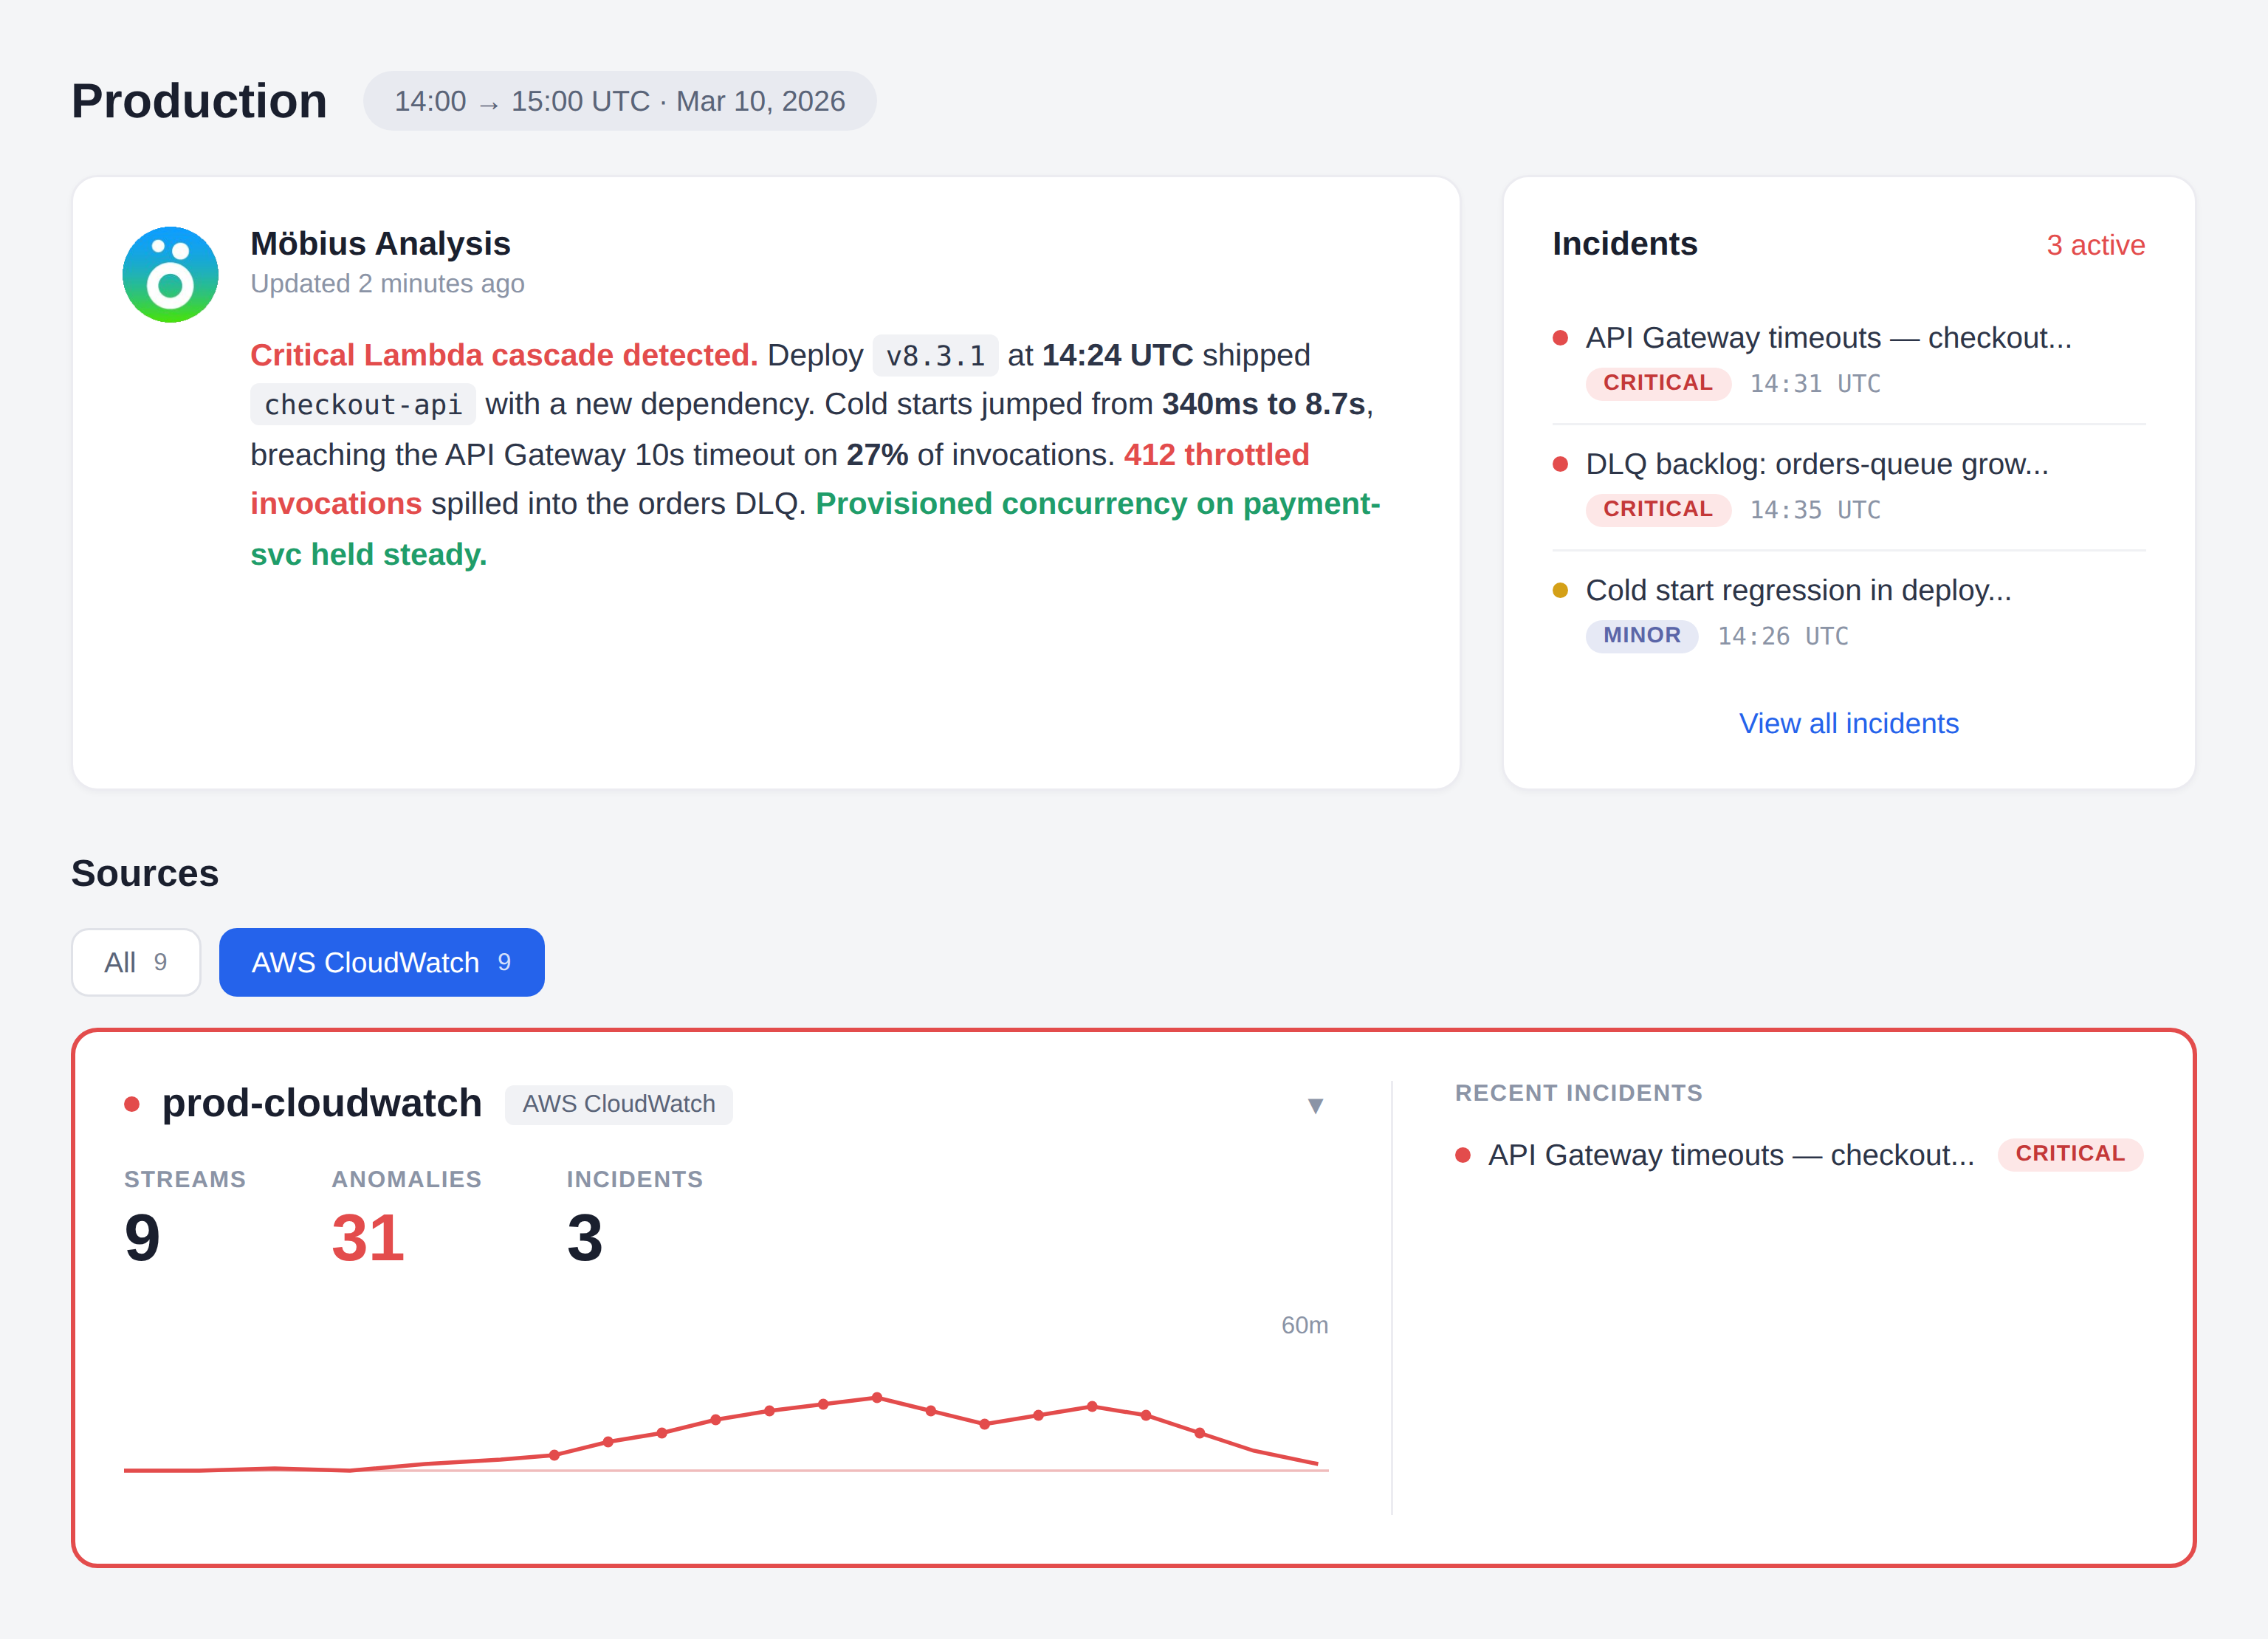
Dstl8’s AI agent watches your log streams for emerging failure patterns across Lambda, Fargate, and anything else you point at it. You find out because Möbius tells you, not because a customer did.
One view per service, regardless of concurrency
Dstl8 flattens log streams from every concurrent Lambda instance and every Fargate task into one logical service view. “checkout-api” is one place to look, not 47 separate streams that shift every time traffic scales.
Root cause narrative with named evidence
Dstl8 doesn’t just group related log lines. Möbius writes a short diagnosis: what happened, which service started it, which events confirm it, and the first thing to try. Every claim links back to the underlying log entries.
Query incidents from Claude Code, Cursor, or your terminal via MCP
The AI agent is reachable from the editor that wrote the code. Ask “what broke in checkout-flow in the last hour” from Claude Code and get an answer built on your live production logs, not a guess.
Bring your OpenTelemetry logs straight in
Add an OTel log exporter to your app code and point it at Dstl8. No Lambda layer, no auto-instrumentation agent, no collector extension running alongside every invocation, no cold-start surcharge. CloudWatch ingestion also works day one for the workloads you want to leave there.
What you get
What AWS Serverless Teams Get With ControlTheory.
MÖBIUS
Proactive root cause analysis, with receipts.
Möbius watches your log surface continuously, clusters related failures into incidents, names the likely cause, and shows the exact log lines that support the diagnosis. You walk into the investigation with the answer already drafted. Ask follow-ups from your editor or terminal without switching contexts.
LAMBDA
Faster answers when “which Lambda failed” is the symptom, not the cause.
1 service view across every concurrent invocation
The question stops being “which of the 47 log streams had the error?” and becomes “what pattern is Möbius seeing, and in which service?” Dstl8 flattens concurrent Lambda instances into one service view and ranks what’s actually broken.
CROSS-SERVICE INCIDENTS
One incident view for Lambda errors, Fargate failures, and API Gateway 5xxs.
You don’t need another isolated log viewer. You need one list of active incidents, grouped by related signal, ranked by impact, with enough context to tell whether the failure started in function code, a Fargate container crash, or a downstream throttle. Möbius does that ranking continuously, so the first thing you see is the thing worth fixing.
ECS / FARGATE
Better Fargate task logs when container failures don’t happen in isolation.
Task-level stdout logs are useful. The real speedup happens when a Fargate container exit is automatically correlated with the upstream Lambda invocations, API Gateway 5xxs, and adjacent queue behavior that caused it. Ingest via the existing awslogs driver. No task redefinition, no sidecar.
OTEL
OpenTelemetry logs from your app, no Lambda layer required.
Add an OTel log exporter to your application code and point it at Dstl8. That’s it. No ADOT Lambda layer, no collector extension running alongside every invocation, no cold-start surcharge from auto-instrumentation. Your function emits structured OTLP logs as part of normal execution. If you already run ADOT for traces, keep it — just route the log signal to Dstl8.
Get Started
Start with terminal-native streaming before you commit to a bigger platform workflow.
2 min to first usable stream
Use Gonzo to tail CloudWatch log groups from your terminal, across Lambda, Fargate, RDS, or any other AWS service that lands logs in CloudWatch. Timestamps in your local zone, flexible filters, and AI-powered summarization on demand. Bring in Dstl8 when you want Möbius doing the proactive detection, cross-service correlation, and in-editor Q&A against your full log surface.
Your options
AWS Serverless Debugging: How Teams Actually Solve This.
Capability
Proactive incident detection
Unified view across Lambda instances and Fargate tasks
Cross-account, cross-region log surface
Pattern and anomaly detection across services
Root cause narrative with cited evidence
Query incidents from Claude Code / Cursor / terminal
CLOUDWATCH CONSOLE ONLY
LOG DRAIN + GENERIC TOOL
ControlTheory
Common questions
AWS Serverless Log Analysis — Questions from Engineering Teams.
Get started
Install & Configure Dstl8 in Under 2 Minutes.
Try the Dstl8 CLI and TUI for continuous runtime feedback. Install it, add sources, connect the MCP server into Claude Code, and more.
brew install control-theory/dstl8/dstl8
dstl8 signup
curl -fsSL https://install.dstl8.ai/script/dstl8-cli | shnpx dstl8nix run github:control-theory/dstl8Download from https://github.com/control-theory/dstl8/releasesQuick Start
# 1. Install the CLI
brew install control-theory/dstl8/dstl8

# 2. Create a Dstl8 account (or `dstl8 login` if you already have one)
dstl8 signup

# 3. Add a source so logs flow in
dstl8 sources add vercel

# 4. Connect your AI agent, auto-detects MCP-compatible clients on your machine and configures them
dstl8 install --all
dstl8 install claude-code
Add Sources
# Add Sources

dstl8 sources add kubernetes
dstl8 sources add cloudwatch
dstl8 sources add vercel
dstl8 sources add supabase
dstl8 sources add otlp
dstl8 sources add github
Start Here
See what’s actually happening.
Connect your deployment chain. Surface emergent patterns. Get root cause analysis with fix recommendations — right in your editor.
↻ Intelligence that compounds — every runtime signal makes the next one sharper.
Dstl8 — Supabase runtime analysis


Open Source
Not ready for Dstl8? Start with Gonzo.
Free, open source log analysis TUI. Real-time charts, pattern detection, AI-powered insights — right in your terminal. No account, no config.
brew install gonzo
Stop Grepping CloudWatch. Let Möbius Find It.
Stream logs into Dstl8. Let Möbius detect, correlate, and diagnose. Trace Lambda errors, Fargate failures, and API Gateway 5xxs across services in one place, or ask your AI agent about them from Claude Code.
Related pages
More for AI code generation reliability.
Stop Grepping CloudWatch.
Let Möbius Find It.
Stream logs with Gonzo. Let Möbius detect, correlate, and diagnose with Dstl8. Trace Lambda errors, Fargate failures, and API Gateway 5xxs across services in one place — or ask your AI agent about them from Claude Code.