Distilling Observability: From Noise to Knowing

ControlTheory's "Distilling Observability" series explores how observability is evolving from raw data capture to continuous, intelligent understanding. From surfacing the right insights, to finding the right answers, to cutting the right costs — this series reframes how teams turn noise into knowledge.
If you’re a DevOps engineer or SRE managing workloads on Kubernetes, you already know how fast your telemetry data grows. A small change to a Kafka consumer or PostgreSQL parameter can ripple through an entire environment. Queues back up, user transactions slow down, and your incident channel starts buzzing.
You open CloudWatch or Datadog. Metrics show rising latency, but they don’t show what’s causing it. You end up in the same place every engineer goes: the logs. That’s where truth lives, but also where time goes to die.
Logs remain the most complete signal we have. The problem is that we collect too much of them, too late, at too high a cost for effective log analysis.
The Modern Observability Pain for SREs and DevOps Engineers
Observability challenges come in many forms. Reasons range across four key areas:
- Coverage – what percentage of your applications are instrumented for observability, and what is stopping you from being at 100% in dev, test, and production?
- Completeness – is the data you are collecting giving the granularity, detail, and insights needed to improve reliability and customer application experience?
- Complexity – are you spending more time building your observability/OTel tooling than on revenue-generating activities?
- Cost – is the increasing cost of operations impacting whether and how you build observability into applications?
All of these factors will come into play regardless of the environmental scale and skill of your engineers.
| Challenge | Common Scenario | Impact |
| Log Volume Explosion | Microservices, Kafka, and functions each generate their own structured logs. A single release can create gigabytes of repetitive data. | High storage and query costs. |
| Delayed Insight | Logs are shipped to CloudWatch or Datadog, parsed, indexed, and queried post-hoc. | Context arrives after incidents occur. |
| Tool Friction | Dashboards summarize symptoms, not causes. Engineers still pivot to CLI or raw logs. | Increased MTTR and cognitive fatigue. |
| Developer Detachment | Front-end and app teams rarely explore observability tools directly. | Slower feedback during continuous deployment. |
In most mid-size environments, observability now costs more than production compute. According to the 2025 Grafana Labs State of Observability report, 87% of organizations rely primarily on logs for root cause visibility. Yet the more we collect, the harder it becomes to find meaning.
Why Traditional Log Pipelines Struggle in EKS Environments
Let’s take two examples from our community:
- Fintech use-case: A regional bank runs a credit-risk platform on Amazon EKS with PostgreSQL (RDS), Kafka, and Python-based scoring services. Each deployment triggers high log churn — Kafka consumer lag warnings, RDS connection resets, and pod restart events.
- SaaS use-case: A B2B analytics product uses React front-ends, Node-based APIs, and Lambda functions for batch jobs. Error bursts during releases flood CloudWatch with thousands of identical traces.
Both teams need full observability for compliance and performance. But they don’t need to ship every log line to CloudWatch or Datadog for effective log analysis. What they need is a way to see structure at the edge, decide what’s useful, and get fast and clear insights from it.

Traditional vs Distilled Telemetry Flow
Enter Gonzo: Real-Time Log Distillation in your Console
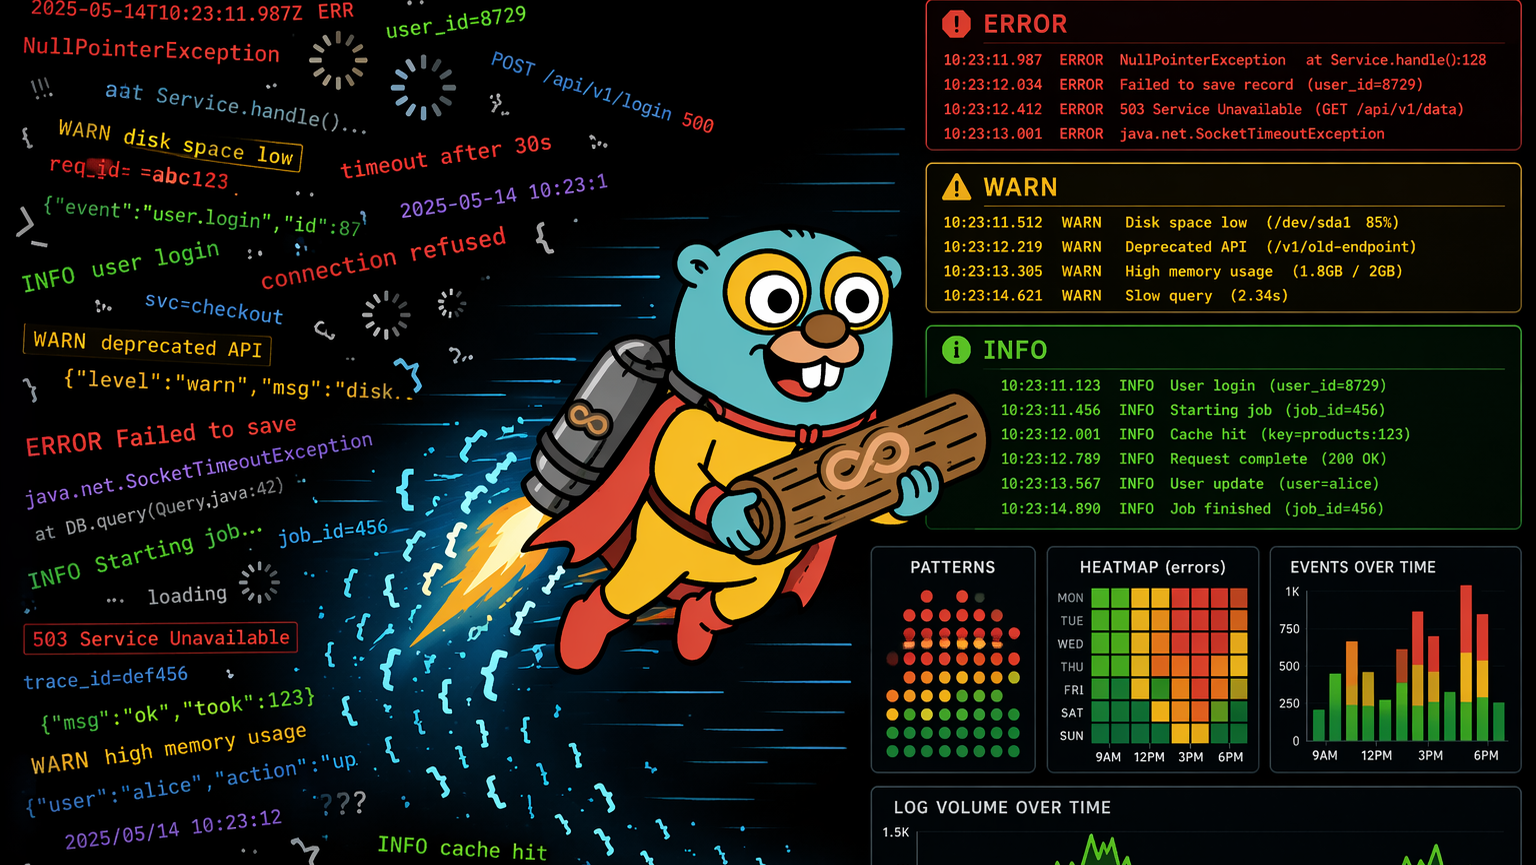
Gonzo is an open-source terminal UI (TUI) built for SREs and DevOps engineers who live in the CLI. It connects directly to OpenTelemetry (OTel) log streams and a wide variety of other formats, automatically grouping, filtering, and highlighting patterns in real time, before logs ever hit your backend.
You can run it locally in your terminal, pointing directly at your Kubernetes cluster logs, or connect it as an OTLP receiver to stream data from your existing OTel collectors or agents.
How it works:
- Point Gonzo at your log source, this could be kubectl logs, integrations like Stern or K9s, or an OTLP stream from your OpenTelemetry Collector, or any instrumented applications.
- Gonzo listens locally or over the network, auto-detects format, and distills incoming telemetry into real-time patterns grouped by severity, service, and version.
- Use Gonzo for instant insights to identify key patterns and surface issues without having to leave the console.
- Continue with your preferred traditional logging flow in parallel for retention and additional forensics.
For example, a simple OpenTelemetry Collector config to mirror production logs to Gonzo might look like this:
receivers:
  otlp:
    protocols:
      grpc:
      http:
exporters:
  otlp/gonzo:
    endpoint: "localhost:4317"
    tls:
      insecure: true
service:
  pipelines:
    logs:
      receivers: [otlp]
exporters: [otlp/gonzo]Now you can launch Gonzo in OTLP mode:
gonzo --otlp-enabled --listen :4317You’ll start seeing log streams from your applications instantly, grouped by service, severity, and attribute. From there, you get insights like surface truths that are hidden in the noise of vast amounts of logs.
In this case, we see:
- Repeated TimeoutError messages in trade-processor pods
- Kafka consumer lag spikes corresponding with RDS connection refused
- 5xx bursts from frontend-api pods during blue/green rollout
Inside Gonzo these patterns are discovered and surfaced for quick troubleshooting without having to pore over logs manually.
From the Log Counts Analysis view, we see patterns that Gonzo has already identified, including groupings by severity.

In the main view, you can tab or click into the logs

All you have to do is press i to initiate analysis of the log detail using a local or hosted AI model of your choice. As you can see in this example below, Gonzo observed the pattern and was able to correlate to a specific source.

With Gonzo, you keep your Datadog, CloudWatch, or Loki pipelines intact. But now you get distilled, high-value telemetry instead of raw volume. Increased clarity, and an opportunity to reduce your observability costs.
The goal is to be able to get instant insights that can drastically cut down MTTR. All without having to open logs manually and you don’t have to leave the terminal!
How Gonzo Finds Problems Faster With Existing Toolchains
Gonzo doesn’t replace your existing tools; it helps you find problems faster by clustering log patterns, highlighting anomalies, and revealing relationships that are often buried in dashboards and complex queries. Gonzo runs alongside your existing pipelines, giving you instant visibility into what’s really happening, directly in your terminal, before you dig into Datadog, CloudWatch, or Loki.
Gonzo analyzes logs in real-time, surfacing root-cause patterns from data that’s already ingested or streaming in. It helps you see structure and meaning faster, without altering or filtering your existing pipelines.
| Platform | What It Provides | How Gonzo Enhances It |
| CloudWatch | Native AWS log collection and alerting | Analyze live log streams to detect repetitive or high-frequency patterns without filtering or dropping data |
| Datadog | Dashboards, metrics, APM | Dual-ship or stream logs to Gonzo for analysis before or after ingestion, depending on your pipeline setup |
| Grafana Loki | Query and visualization | Adds contextual layers to logs live tailed from Grafana Loki, highlighting service, region, and deployment-level attributes for faster correlation |
| OpenTelemetry | Unified data model, rich attributes/metadata | Bubbles up patterns in logs so you can identify trends and signals; attributes/metadata stats & filtering. |
| Other Logs | Query and visualization | Analyze static files or stream any log for real-time analysis using the interactive TUI |
Faster Clarity in a Financial Services Stack
In one scenario, an SRE and a developer collaborate using Gonzo in the same EKS cluster that runs their credit risk workloads. The SRE spots anomalies across Kafka and RDS; the developer traces the faulty service version in seconds, all from the terminal.
During a release, queue delays appeared in Kafka, and transaction latency increased. Gonzo surfaced the issue immediately: a single version of the scoring service was retrying RDS writes in a loop.
Instead of scrolling through 400,000 redundant log lines, the engineer saw three clustered error patterns in under 30 seconds. The engineer retained those clustered patterns in Datadog for audit tracking and used the insights to tune their CloudWatch retention, keeping only the logs that mattered for compliance. Gonzo doesn’t filter logs directly; it provides the signal that helps teams optimize what they send downstream.
The outcome: faster triage, lower data egress, and zero loss of visibility.
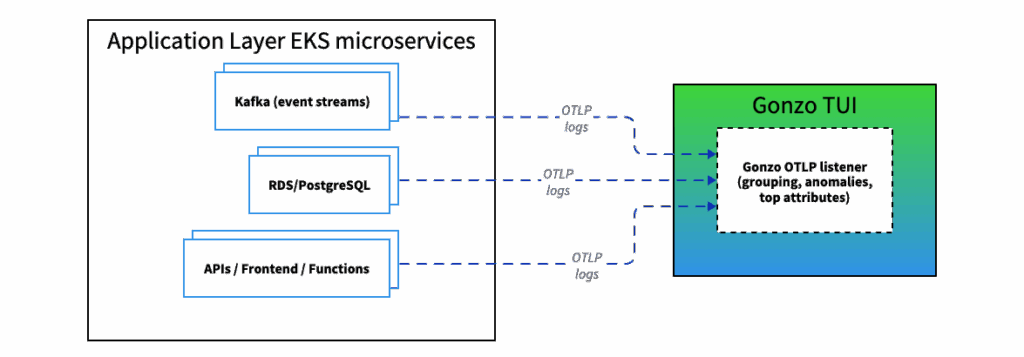
Streaming Telemetry From Microservices to Gonzo
Why Logs Still Matter (and Always Will)
Metrics and traces show symptoms. Logs explain the behavior that caused them. They are still the most granular, human-readable view of a system’s truth.
The goal isn’t to collect less; it’s to collect intelligently by distilling insights from volumes of noisy logs. Gonzo gives SREs, DevOps, and Ops engineers the controllability they’ve been missing: distillation before ingestion, insight before query, and clarity before cost.
Gonzo Quick Start Guide
Install with Homebrew:
brew install gonzoThen run against your EKS environment:
kubectl logs -f deployment/my-app | gonzoWatch as repetitive noise compresses into actionable clusters, live in your terminal, before it becomes another terabyte of usage in your observability bill.
Control your observability. Don’t let it control you.
Keep an eye out for Part 2 of ControlTheory’s “Distilling Observability” series to learn more about how how observability is evolving from raw data capture to continuous, intelligent understanding.
Table of Contents
Surface Unknown Unknowns Automatically
Catch emergent patterns from AI-generated code in staging—before they become production incidents.
press@controltheory.com


 Back
Back