Vibe coding debugging is the bottleneck nobody’s talking about. Here’s how to fix it on the Vercel + Supabase stack – from your terminal.
If you’re shipping AI-native apps right now, your stack probably looks like this: Claude Code or Cursor writing the code, Next.js on Vercel running it, Supabase handling data and auth. It works. You can go from idea to deployed prototype in a sitting.
But there’s a gap nobody talks about, and it bites the moment you need to debug something that went wrong in production.
Vibe coding is fast. Vibe coding debugging is not.
Here’s what the AI dev cycle actually looks like in practice: prompt, generate, deploy, move on.
The “generate” part got insanely fast. Y Combinator reported that 25% of their Winter 2025 batch had codebases 95% AI-generated. NxCode estimates 92% of US developers have adopted some form of AI-assisted coding as of early 2026. The tools are genuinely good.
But what happens after you deploy?
Nothing. You push, it hits Vercel’s edge network, requests start flowing to Supabase, and you alt-tab back to the editor for the next prompt. No runtime signal feeding back into your workflow. No context about what the code is actually doing.
This matters more for AI-generated code than for code you wrote line by line. When you wrote it, you have a mental model of how it should behave. When an AI wrote it, you have vibes. And when it breaks, vibe coding debugging starts – except there’s nowhere to look.
Builder.io put it bluntly: observability in vibe-coded projects is an afterthought – gaps get discovered after incidents, not before. And the State of Software Delivery 2025 report found that most developers spend more time debugging AI-generated code than writing it manually would have taken.
Code generation got 10x faster. Runtime visibility stayed at zero. The bottleneck moved.
Why vibe coding debugging breaks on Vercel + Supabase
It’s not just that the Vercel + Supabase stack lacks observability. It’s that observability is actively fragmented across two platforms with no shared debugging surface.
Vercel doesn’t store runtime logs by default. They recommend third-party log drains for persistence. On Pro you get 3 days of retention. Log drains are gated to Pro and Enterprise at $0.50/GB. If you’re a solo builder on Hobby – which describes a lot of the vibe coding crowd – you can’t export your logs at all.
Vercel’s monitoring tab gives you request counts and error statuses at a glance, but that’s about it for in-depth troubleshooting.
Supabase is a different kind of beast. Nine distinct log sources: edge_logs, postgres_logs, postgrest_logs, auth_logs, storage_logs, realtime_logs, function_logs, function_edge_logs, supavisor_logs. Each in its own table. The Log Explorer uses a subset of BigQuery SQL, not standard SQL. And the tables can’t be joined – there are no shared keys between them.
Verbose logging can eat your disk and degrade performance. Edge Functions cap at 100 log events per 10 seconds. Hit a hot path during debugging and logs silently drop.
But the real problem is the gap between the two. When a user hits your Next.js route on Vercel, which calls Supabase via PostgREST, which queries Postgres, which fires a Realtime event – there’s no single view of that chain. You’re alt-tabbing between two dashboards, eyeballing timestamps.
This isn’t hypothetical. In a Supabase GitHub discussion, developers reported requests that worked perfectly locally but showed no associated auth user in Supabase’s production logs – while Vercel logs confirmed the token was passing through correctly. A cross-platform ghost, invisible unless you happen to be staring at both sides at the exact right moment.
Fixing vibe coding debugging with Gonzo
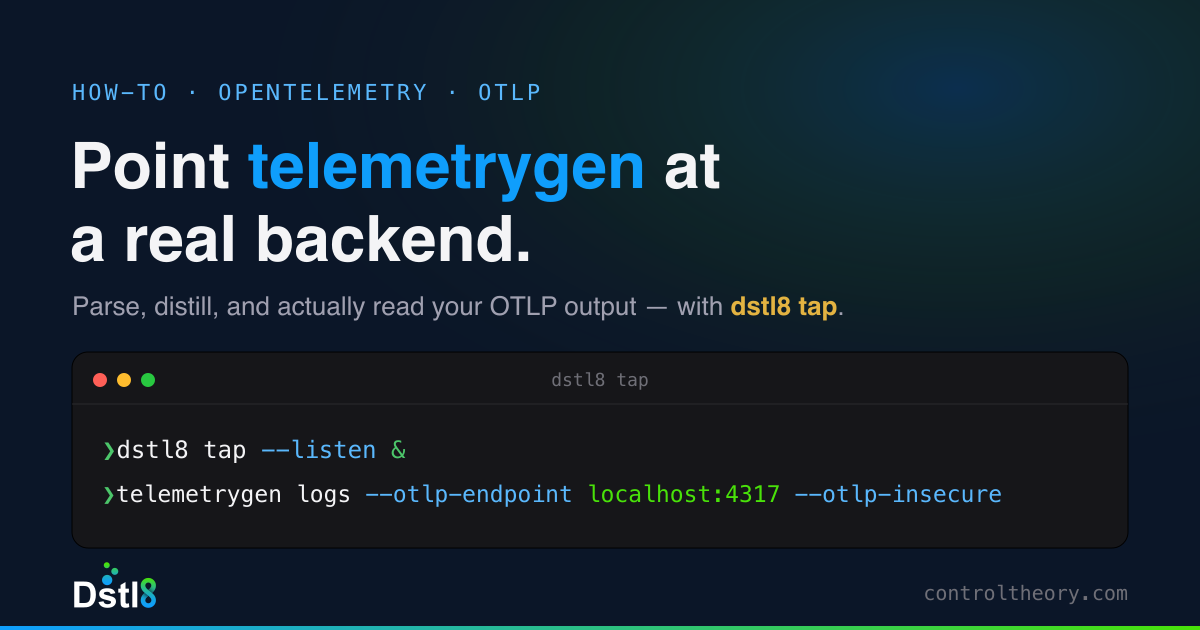
Gonzo is our open-source terminal UI for real-time log analysis. Session-scoped, zero-persistence, no cloud account required. It already has integrations for both platforms individually:
- Vercel: A jq normalizer that unwraps the double-encoded
messagefield fromvercel logs -jand merges Vercel’s envelope metadata. - Supabase: A log poller that pulls all nine log sources from the Supabase Management API and normalizes them into JSONL.
The trick is combining them. It’s a bash block:
{
  vercel logs https://gonzo-pipe-test-3.vercel.app -j 2>/dev/null | jq --unbuffered '
    (.message | sub("^\\[.*?\\] "; "")) as $raw
    | (try ($raw | fromjson) catch {msg: $raw})
    + {source, requestPath, domain, requestMethod, responseStatusCode}
    + {platform: "vercel"}
  ' 2>/dev/null &
  POLL_INTERVAL=15 ./supabase-log-poller.sh 2>/dev/null | jq --unbuffered -c '. + {platform: "supabase"}' 2>/dev/null &
  wait
} | gonzoTwo background pipelines. Each tags its output with platform. Both write to the same stdout. Gonzo reads one merged stream. No wrapper scripts, no orchestration.
What we actually saw
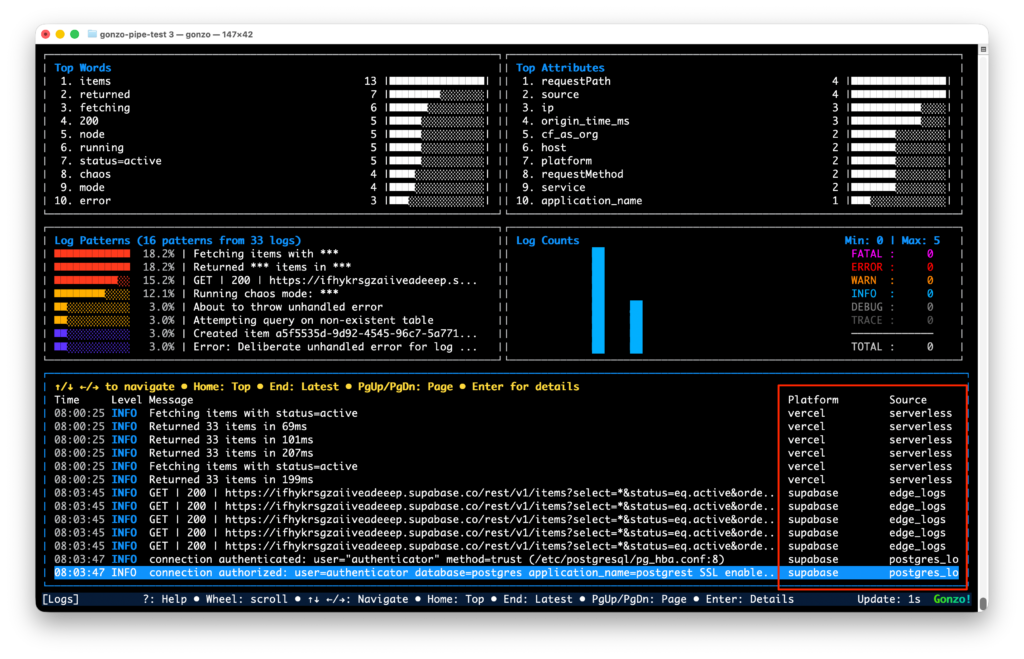
We deployed a test app – a few Next.js API routes that read, write, and break things across both platforms. With the pipe running, a single POST /api/items shows up as correlated entries in the same Gonzo session:
- Vercel side: the serverless function log –
[items:write] Inserting item: pipe-test-1776088798 - Supabase side: the API gateway log –
GET /rest/v1/items?select=*&status=eq.activewith full request metadata, Cloudflare colo, origin time, response status
Errors are where it really helps. Querying a table that doesn’t exist from a Vercel function produces two entries side by side – the Vercel error log and the Supabase Postgres 42P01 error – correlated by timestamp in the same terminal.
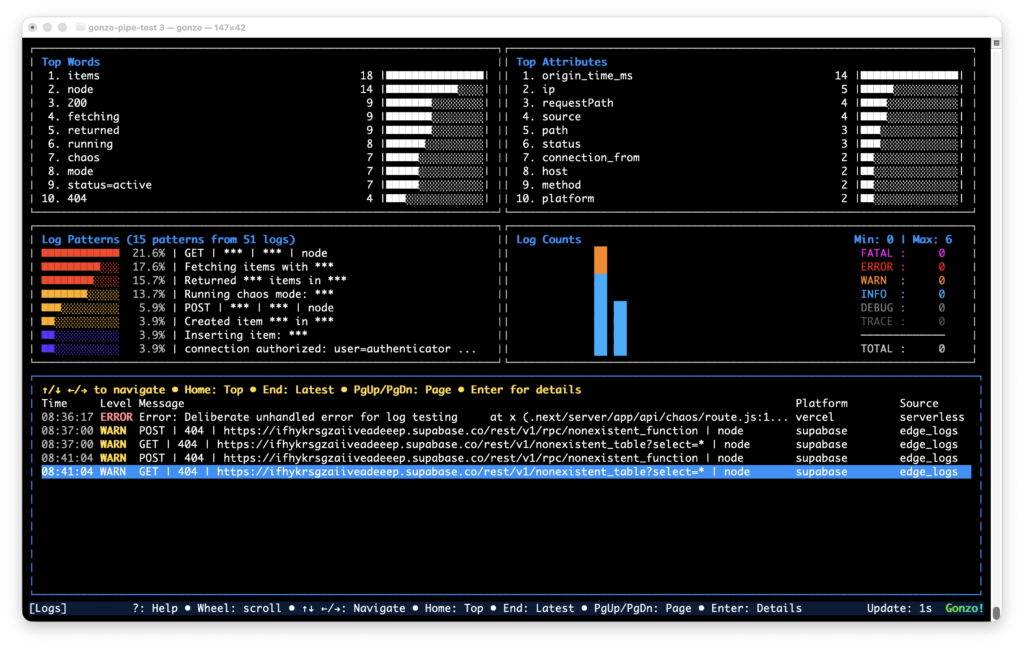
Gonzo recently merged a column picker (press C in the log viewer) that auto-discovers columns from incoming data. Toggle platform on, and every line shows vercel or supabase inline. Combined with the source column – lambda, edge, edge_logs, postgres_logs – you can see which platform and which service each log came from at a glance.
No log drains. No Datadog bill. The whole feedback loop in your terminal, next to the code.
What we learned along the way
Rate limits are real. The Supabase Management API throttles aggressively. The poller hits 9 endpoints per cycle, so POLL_INTERVAL=5 gets you throttled fast. The default of 30 seconds is more sustainable. That means Supabase logs lag Vercel by up to 30 seconds – Vercel streams in real time via the CLI, Supabase is poll-based.
Naming collisions are confusing. Vercel’s source field has a value called edge (the Edge Runtime). Supabase’s sourcefield has edge_logs (the API gateway). Completely different things. The platform tag eliminates the ambiguity.
The Vercel CLI leaks non-JSON. vercel logs -j occasionally prints waiting for new logs... to stdout, which isn’t valid JSON. The 2>/dev/null on the jq stage catches most of it.
When you need debugging that doesn’t sleep
Gonzo works great for the active session. You’re in the terminal, you’re debugging, you’re watching.
Most problems in AI-generated code don’t show up while you’re watching. They show up at 2am in staging, or in the preview deployment you forgot to check, or when a teammate’s PR hits the Vercel preview branch and starts throwing auth errors against Supabase that nobody notices until morning.
Dstl8 fills that gap. Where Gonzo gives you on-demand runtime context, Dstl8 provides it continuously – across pre-production and production – with an AI agent called Möbius watching your environments whether you’re looking or not. Pattern detection, anomaly alerts, incident timelines. When you open your editor in the morning, the context from last night is already there waiting via the MCP integration.
Think of it as a natural progression: Gonzo for the active dev loop. Dstl8 for the always-on runtime context layer across every environment your code touches.
The AI dev stack got fast at writing code. Vibe coding debugging is still stuck in 2020 – scattered dashboards, ephemeral logs, zero cross-platform correlation. The tools to close the gap exist. They just haven’t been wired together.
Four lines of bash and an open-source TUI is a start.
Gonzo is MIT licensed. The Vercel integration and Supabase log poller both ship with the repo.
Table of Contents
Runtime Feedback for Agentic Engineers
Catch emergent patterns from AI-generated code fed directly back to your agent.
 Back
Backpress@controltheory.com