Now you can get some GUI with your TUI! And it’s all local.
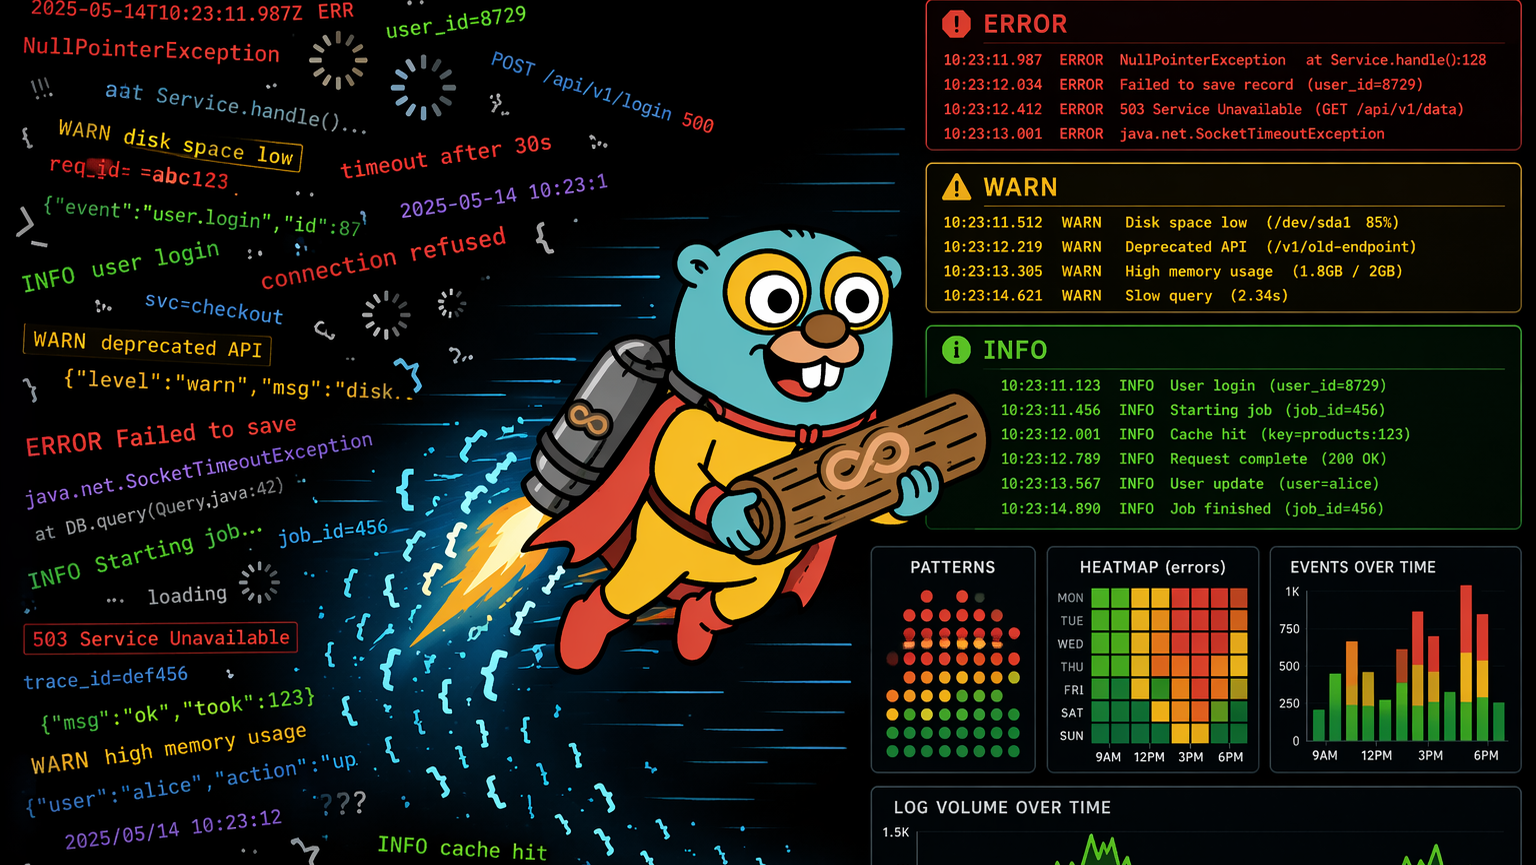
For most of us, looking at our own OpenTelemetry logs still means standing up a collector, wiring a debug exporter, and squinting at JSON. We built Gonzo to skip that loop. Point your app’s OTLP exporter at Gonzo, run your code, and your logs land in a terminal UI built for OpenTelemetry. No backend, no YAML, no waiting on ingest.
OTLP isn’t the only way in. Gonzo also tails Kubernetes pods, local files, and anything you can pipe over stdin. Same TUI in every case. The getting started docs walk through each.
That has been the workflow for a while. Today we’re adding a second surface to it.
What’s new
Inside any Gonzo session, press d.
A local GUI opens in your browser, pointed at the same data Gonzo is already streaming. Same process, same logs, no extra setup. Nothing leaves your machine.
It works on whatever you’re feeding Gonzo. OTLP, kubectl logs, a tailed file, a stdin pipe. Same keystroke every time.
We’re calling it Dstl8.Lite. It’s a free, local-only slice of our commercial product, Dstl8, packaged into the Gonzo binary. One install. Two surfaces. Pick the one that fits.
No observability backend required
Single binary on your laptop. No SaaS account, no ingest pipeline, no contract. Run it anywhere a binary runs.
Why a GUI for a TUI?
Two reasons.
The TUI and the GUI are good at different things. The terminal is the right surface when you’re tailing live output, scanning for a specific severity, or iterating on a config change. The browser is the right surface when you want to sort by frequency, eyeball a histogram, share a screenshot with a teammate, or copy log lines straight into Claude or Cursor when you need a second pair of eyes. You no longer have to pick. Same binary, same data, two views.
Structure for humans is structure for agents. The faster you can see what your code (or your AI assistant) actually emits, the faster you catch the cheap bugs that hide in raw JSON. Missing attributes. Wrong severity. Schema drift between services. Dstl8.Lite is one more way to look at that data.
The kinds of bugs this catches
These are the two we demo most often, both of which traditional alerting will quietly miss:
Missing attribute. order_id is in scope but never makes it onto the log record. You only notice when an on-call engineer can’t pivot on it at 2am.
logger.info("payment succeeded",
extra={"user_id": uid, "amount": amt}) # order_id, anyone?Wrong severity. A failure path logged at INFO. Your dashboards stay green. Your alerts stay quiet.
except Exception as e:
logger.info(f"payment failed: {e}", ...) # should be ERRORBoth are obvious the second you can see your own telemetry. Hard to catch if you can’t.
Try it
For OTLP:
brew install gonzo
gonzo --otlp-enabled
Point your app at localhost:4317 (gRPC) or localhost:4318 (HTTP).
For Kubernetes (uses your existing kubeconfig, no extra auth):
gonzo --k8s-enabled=trueFor a local file (or anything else you can pipe to stdin):
tail -f ./app.log | gonzo
Whichever mode, press d when you want the GUI.
Gonzo is MIT licensed and lives at github.com/control-theory/gonzo (2.7k stars and counting). Dstl8.Lite ships with it. Full walkthrough in the Dstl8.Lite GUI docs.
See it live this Thursday
If you’re at Observability Summit NA 2026 in Atlanta, I’m giving a lightning talk on this exact workflow. Ten minutes, live demo, both surfaces. Learn more here…
From Collector to Terminal: A Better Way to See Your OpenTelemetry Logs Thursday, May 21, 2026, 12:05 to 12:15 PM CDT Level One, Ballroom B
Come say hi after. I’d love to hear what you’d want a local OTel UI (and TUI!) to do next.
Jon Reeve Co-Founder and CPO, ControlTheory @j_m_reeve on X · @j0nr33v3 on GitHub
Table of Contents
Surface Unknown Unknowns Automatically
Catch emergent patterns from AI-generated code in staging—before they become production incidents.
 Back
Backpress@controltheory.com