


Capability · Continuous Distillation
Continuous Distillation. Always-On Analysis, Not Periodic Checks.
The bugs that hurt are not the ones that crash. They are the silent shifts: a retry loop firing ten times more than yesterday, a pattern that drifted after the last deploy, a code path that started failing for one tenant. Dstl8 continuously distills every log into patterns, samples, and anomalies, so its Möbius agent names the shift the moment it starts, not after the dashboards catch up. You catch the regression before it becomes the incident.
brew install control-theory/dstl8/dstl8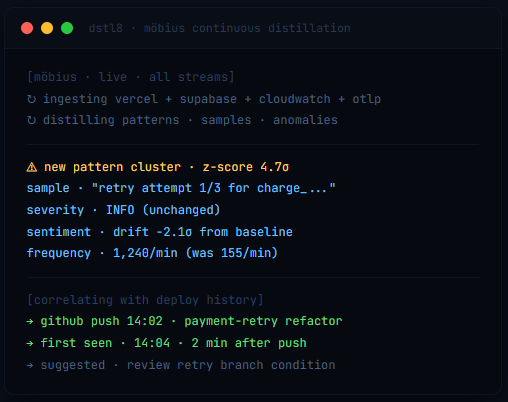
Continuous
runtime distillation
Pre-LLM
signal extraction
3 Loops
intent · iter · prod
11
platforms integrated
What changed
Your code ships faster. The runtime feedback loop didn’t keep up.
You are shipping in hours, not weeks. Every push changes runtime behavior in ways nobody can fully predict, especially when an agent wrote the diff. The standard playbook for catching issues was built for a slower world: alerts on thresholds, dashboards you check, logs you tail when something already feels wrong. That playbook misses everything that happens between checks. That gap is where this use case lives.
Closing this gap means analysis runs continuously, before you ask, and surfaces what shifted in terms a human or an agent can act on.
TLDR
Periodic checks miss what happens between them. Continuous distillation surfaces the shift the moment it starts, not after you go looking.
How Dstl8 works
Four parts of Continuous Distillation.
The pipeline that turns raw streams into patterns, samples, and anomalies, and the feedback loops it feeds.
01
Every log distilled, continuously, before it hits a model.
Dstl8 runs a deterministic distillation pipeline over every connected stream: pattern detection, clustering, severity analysis, sentiment analysis, continuous z-score anomaly analysis across severity and sentiment, and a key-log sampling algorithm that pulls high-signal examples out of high-volume streams. The output is patterns, samples, and anomalies, all compact, structured, and queryable. Möbius reasons on that, not on the raw firehose.
# in
raw streams · vercel · supabase · cloudwatch · otlp
# out (continuous)
patterns · samples · anomalies · ready for möbius
02
Signal, not severity.
Vercel stdout is all INFO. Supabase logs lean noisy. AWS CloudWatch was built for storage, not analysis. Dstl8 runs continuous z-score anomaly analysis across both the severity and sentiment dimensions of every distilled stream, so a pattern that drifts away from baseline in either dimension (a quiet rise in negatively phrased INFO lines, an unexplained shift in the severity distribution, a frequency jump that does not trip any threshold) surfaces as a statistical anomaly automatically. Pre-LLM signal extraction means the agent sees the regression, not the noise around it.
03
Three feedback loops, one knowledge graph, compounding intelligence.
Loop 1 (Intent): before coding, the knowledge graph surfaces past incidents and patterns relevant to what is about to change. Loop 2 (Iteration): during dev and staging, cross-environment comparison catches the regression before it promotes to production. Loop 3 (Production intelligence): after deploy, Dstl8 triages, suggests a fix, verifies the result, and persists what was learned back into the knowledge graph for Loop 1. Each loop feeds the next.
# loop 1 · intent
past incidents · patterns · surfaced before the diff
# loop 2 · iteration
dev → staging · cross-env comparison · catch regressions early
# loop 3 · production intelligence
triage · fix · verify · persist to knowledge graph
04
OpenTelemetry native, your existing streams.
Dstl8 ingests what you already emit: OTLP, AWS CloudWatch, Vercel runtime logs, Supabase, Kubernetes, GitHub deploy events, and more. No new instrumentation, no agent on every box, no schema you have to learn. The distillation pipeline produces the same patterns and anomalies regardless of source, so a hybrid stack reads as one continuously updated state.
TLDR
Raw logs become patterns, samples, and anomalies before they ever reach a model. Möbius reasons on signal, not on the firehose, across three feedback loops that compound.
Real world use case
The deploy looked fine. The pattern said otherwise.
A common scenario for teams running on a PaaS where everything stdout-logs as INFO and no error threshold ever trips. The regression is in the shape of the traffic, not the severity of the log lines.
Without Dstl8.
You ship a refactor to the payment retry handler. Everything looks fine. Vercel function logs are all 200s and INFO lines. AWS CloudWatch metrics look normal. Error rates have not moved. Two days later, your AWS bill starts climbing. Three days later, a customer notices their card was charged twice. You open Vercel logs, scroll, scroll, scroll. The pattern was sitting there the whole time: the retry handler is firing on success now, not just on failure, because the new branch evaluates the response shape differently. The signal was in the volume of retry log lines, not in the level of any single one.
With Dstl8.
Möbius is already watching. Continuous distillation produced a new pattern cluster within minutes of the deploy: a retry-handler log line whose frequency jumped 8x against the previous baseline, with severity unchanged. The knowledge graph correlated the cluster against the GitHub push that landed minutes earlier and surfaced a past incident with the same retry-handler signature. The MCP server returned the cluster, the sample lines, the deploy that caused it, and the historical fix. The agent applied the patch. The cluster collapsed back to baseline on the next deploy. One commit. Two days of double charges that never happened.
Scenario: silent regression after deploy · Runtime surface: Vercel + Supabase + GitHub
Outcome difference: three days to customer report → fifteen minutes to applied fix

TLDR
All INFO, no alerts, no error spike. Möbius caught the frequency shift in minutes, before it became three days of double charges.
Why Dstl8?
Continuous distillation built for runtime, not for storage.
Continuous
Continuous, not periodic.
Dashboards wait for you to check them. Threshold alerts wait for thresholds. Dstl8 runs distillation continuously across every connected stream, so the regression surfaces the moment the pattern shifts, not the moment somebody opens the right tab. The pattern, the sample, and the deploy that caused it are already assembled when you (or your agent) ask.
Signal
Pre-LLM signal extraction.
The agent does not see raw logs. It sees patterns, samples, and anomalies that the distillation pipeline already extracted, including continuous z-score anomaly analysis across severity and sentiment. Statistically grounded, severity-blind, frequency-aware.
No storage
Analyze every log, store only what matters.
Dstl8 distills the stream as it ingests. You do not pay to warehouse every line forever, and you do not lose the patterns the warehouse would have surfaced. Signal gets persisted; noise gets discarded.
Compounding
Three loops, one knowledge graph, intelligence that compounds.
Intent (before coding) → iteration (dev and staging) → production intelligence (after deploy) → persisted back into the knowledge graph for the next intent. Each shipped fix makes the next session sharper. The longer Dstl8 watches your chain, the less the same class of issue gets to recur.
Common questions
What teams ask before adopting this.
Get started
Install & Configure Dstl8 in Under 2 Minutes.
Try the Dstl8 CLI and TUI for continuous runtime feedback. Install it, add sources, connect the MCP server into Claude Code, and more.
brew install control-theory/dstl8/dstl8
dstl8 signup
curl -fsSL https://install.dstl8.ai/script/dstl8-cli | shnpx dstl8nix run github:control-theory/dstl8Download from https://github.com/control-theory/dstl8/releasesQuick Start
# 1. Install the CLI
brew install control-theory/dstl8/dstl8

# 2. Create a Dstl8 account (or `dstl8 login` if you already have one)
dstl8 signup

# 3. Add a source so logs flow in
dstl8 sources add vercel

# 4. Connect your AI agent, auto-detects MCP-compatible clients on your machine and configures them
dstl8 install -all
dstl8 install claude-code
Add Sources
# Add Sources

dstl8 sources add kubernetes
dstl8 sources add cloudwatch
dstl8 sources add vercel
dstl8 sources add supabase
dstl8 sources add otlp
dstl8 sources add github
Start Here
See what’s actually happening.
Connect your deployment chain. Surface emergent patterns. Get root cause analysis with fix recommendations — right in your editor.
↻ Intelligence that compounds — every runtime signal makes the next one sharper.
Dstl8 — Supabase runtime analysis


Open Source
Not ready for Dstl8? Start with Gonzo.
Free, open source log analysis TUI. Real-time charts, pattern detection, AI-powered insights — right in your terminal. No account, no config.
brew install gonzo
Stop waiting for the dashboard to tell you something broke.
Free Dstl8 account. Connect your existing log sources, no new instrumentation. Möbius starts distilling on the first stream and surfacing patterns within minutes.
The signal was there. Now you can see it.
Continuous distillation, every layer, every deploy. No dashboard archaeology.