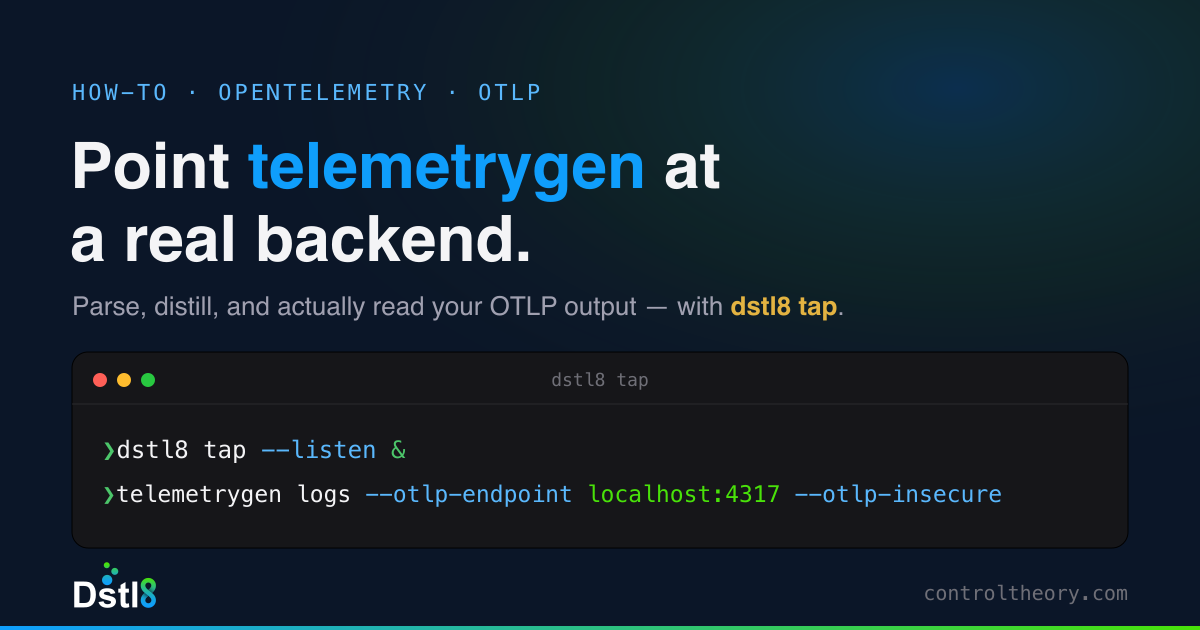
📌 UPDATE (July 16, 2026):telemetrygenwill happily fire traces, metrics, and logs at your collector all day – but you still need somewhere to actually read the output. Our new companion guide points telemetrygen straight atdstl8 tap, a drop-in local OTLP receiver that parses, distills, and streams the data live in a single terminal – no backend to stand up. How to Point telemetrygen at a Real Backend with Dstl8 tap.
If you’re building or validating an OpenTelemetry (OTel) Collector pipeline, there’s one thing you’ll need before anything else: telemetry. But getting access to real-world traces, metrics, and logs isn’t always easy — especially when you’re in development, testing transformations, or troubleshooting data routing. Last week we looked at a telemetry generation tool called otelgen – this week we’re looking at another called telemetrygen – this one packaged in the OpenTelemetry Contrib Collector itself (or OTel collector contrib)
telemetrygen — is a simple tool purpose-built for generating OpenTelemetry-compatible telemetry data on demand.
In this post, we’ll show you how to use telemetrygen to:
- Quickly generate traces, metrics and logs
- Validate OpenTelemetry Collector configurations
- Simulate production-like telemetry for development and testing
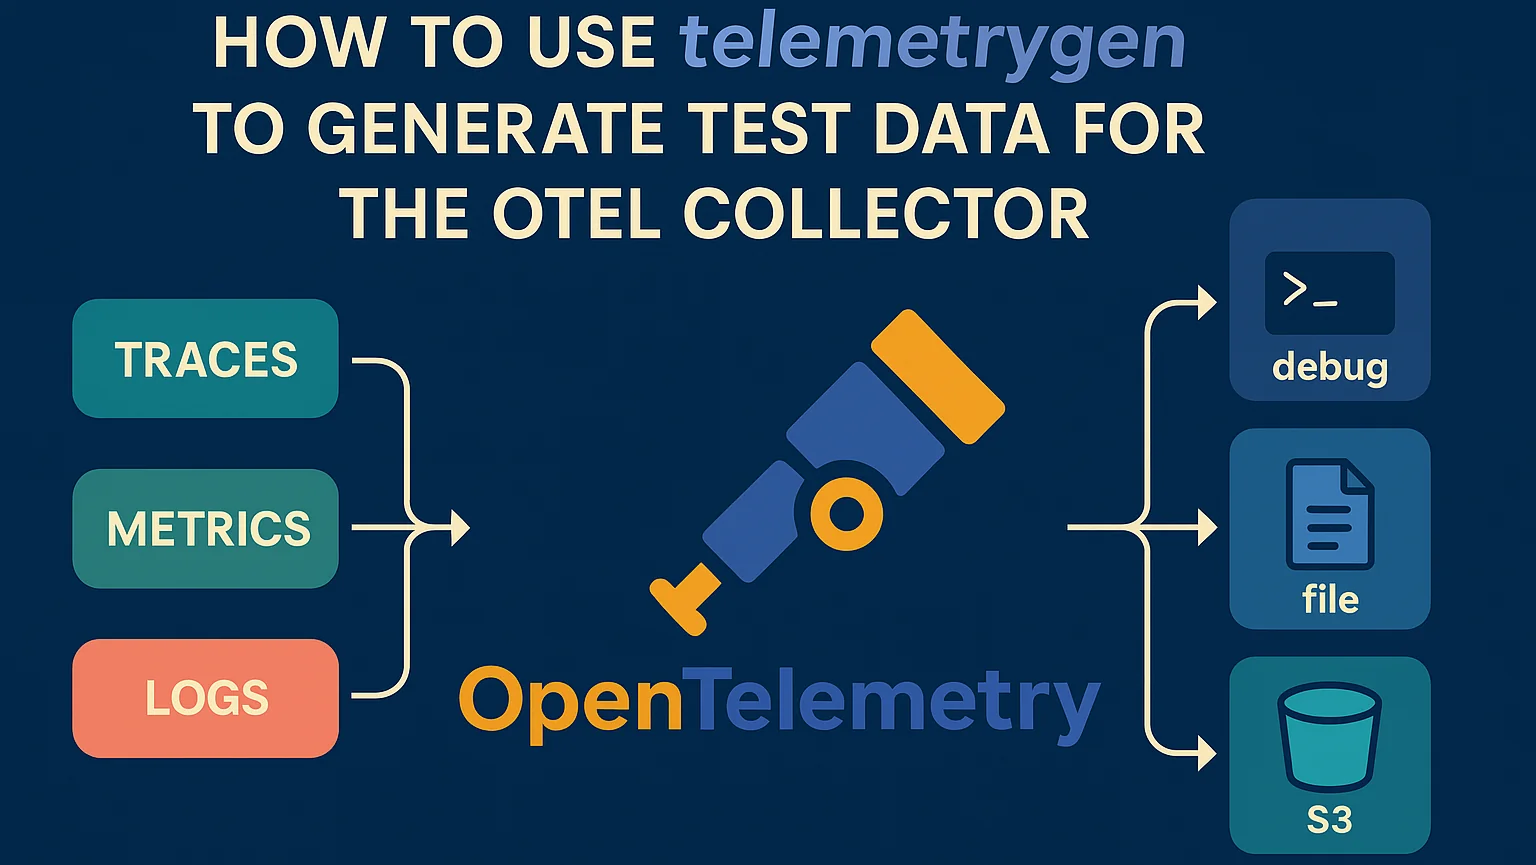
🔧 What Is telemetrygen?
telemetrygen is a lightweight telemetry generator included in the OpenTelemetry Collector Contrib repo (OTel collector contributor). It emits trace, metric and log data using the OpenTelemetry Protocol (OTLP) — which makes it perfect for testing OTel Collector pipelines.
You can:
- Emit traces with custom service names, spans, and latency
- Generate metrics with configurable values and intervals
- Send telemetry to any OTLP receiver (HTTP or gRPC)
📦 Installing telemetrygen
You can run telemetrygen directly from Docker (in this case pointing at an OTel collector running locally on our Mac) — no Go or local build required:
docker run --rm ghcr.io/open-telemetry/opentelemetry-collector-contrib/telemetrygen:latest \
  traces \
  --otlp-endpoint=host.docker.internal:4317 \
--otlp-insecure🔁 If you’re using Linux (vs Mac), replace
host.docker.internalwith localhost or your host IP.
Or we can install locally with Go if we prefer:
go install github.com/open-telemetry/opentelemetry-collector-contrib/cmd/telemetrygen@latest🚀 Example: Sending Test Traces to the OpenTelemetry Collector with telemetrygen
Let’s assume you’ve got the OpenTelemetry Collector running locally (on our Mac again) with an OTLP receiver on port 4317. You can send sample traces like this using Docker:
docker run --rm ghcr.io/open-telemetry/opentelemetry-collector-contrib/telemetrygen:latest \
  traces \
  --otlp-endpoint=host.docker.internal:4317 \
--otlp-insecure \
--duration=30s \
--rate=5 \
--service="test-service"This generates:
- 5 spans per second
- A duration of 30 seconds
- Spans tagged to the service
test-service
This is a great way to simulate what actual application telemetry would look like in a live environment — without having to instrument a real app. Replace traces with metrics or logs to try different telemetry types, and use the help option to explore all parameters like
docker run --rm ghcr.io/open-telemetry/opentelemetry-collector-contrib/telemetrygen:latest metrics -h🧪 Validating an OTel Collector Pipeline
Using telemetrygen, you can quickly verify:
- That your OTLP receiver is working
- That your processors (e.g., filter, transform, dedupe) behave as expected (the tap processor can be handy here too….)
- That your exporters (e.g., debug, OTLP, or third-party destinations like Datadog or Prometheus) are receiving the data
Example Docker Compose to test it where otel-config is the collector configuration you’ve constructued locally to test (see here for an example sample collector config):
services:
  otel-collector:
    image: otel/opentelemetry-collector-contrib:latest
    command: ["--config=/etc/otel/config.yaml"]
    ports:
      - "4317:4317"
    volumes:
      - ./otel-config.yaml:/etc/otel/config.yaml

  telemetrygen:
    image: ghcr.io/open-telemetry/opentelemetry-collector-contrib/telemetrygen:latest
    depends_on:
      - collector
    command:
      [
        "traces",
        "--otlp-endpoint=host.docker.internal:4317",
        "--otlp-insecure",
        "--duration=30s",
        "--rate=10"
]This will spin up a self-contained telemetry test harness.
🔍 Example Use Cases
- 🔁 Testing processors like
transform,filter, ortail_sampling - 📊 Validating metric pipelines before rolling out Prometheus scraping
- 🔐 Testing OTLP receivers with TLS, authentication, or custom headers
- 💸 Simulating high volume traffic to evaluate collector performance or cost impact
🌟 Tips for Effective Use
- Use
--telemetry-attributesto add test attributes for filtering or routing (e.g.--telemetry-attributes='env="dev",region="us-central",feature_flag="on"') - Combine with
debugorfileexporters to verify output structure - Pair with a backend like Grafana, Jaeger, or Datadog to visualize trace flow
✅ Conclusion
If you’re working with the OpenTelemetry Collector, telemetrygen is one of the fastest ways to validate your configuration and generate sample telemetry on demand. Whether you’re testing a brand new pipeline or debugging production behavior in a staging environment, it gives you the flexibility to move fast — without waiting on real services.
Next step: once telemetrygen is generating data, see how to actually read it without building a backend — point telemetrygen at
dstl8 tapand watch the stream get parsed and distilled in one terminal.
Want help optimizing your OTel pipeline or replacing the Datadog agent with the OpenTelemetry Collector?
Table of Contents
Runtime Feedback for Agentic Engineers
Catch OTel, K8s, LLM, agentic patterns from AI-generated code - fed directly back to your agent.
 Back
Backpress@controltheory.com