


As more teams adopt OpenTelemetry (OTel) to unify observability signals across metrics, logs, and traces, one of the most critical decisions is how to deploy the OpenTelemetry Collector. The right deployment pattern can dramatically affect scalability, latency, resilience, and manageability — especially as your telemetry footprint grows.
In this guide, we explore common OpenTelemetry Collector deployment models and the trade-offs that architects and SREs should consider in the planning phase.
Agent vs Gateway: which OTel Collector deployment model should you choose?
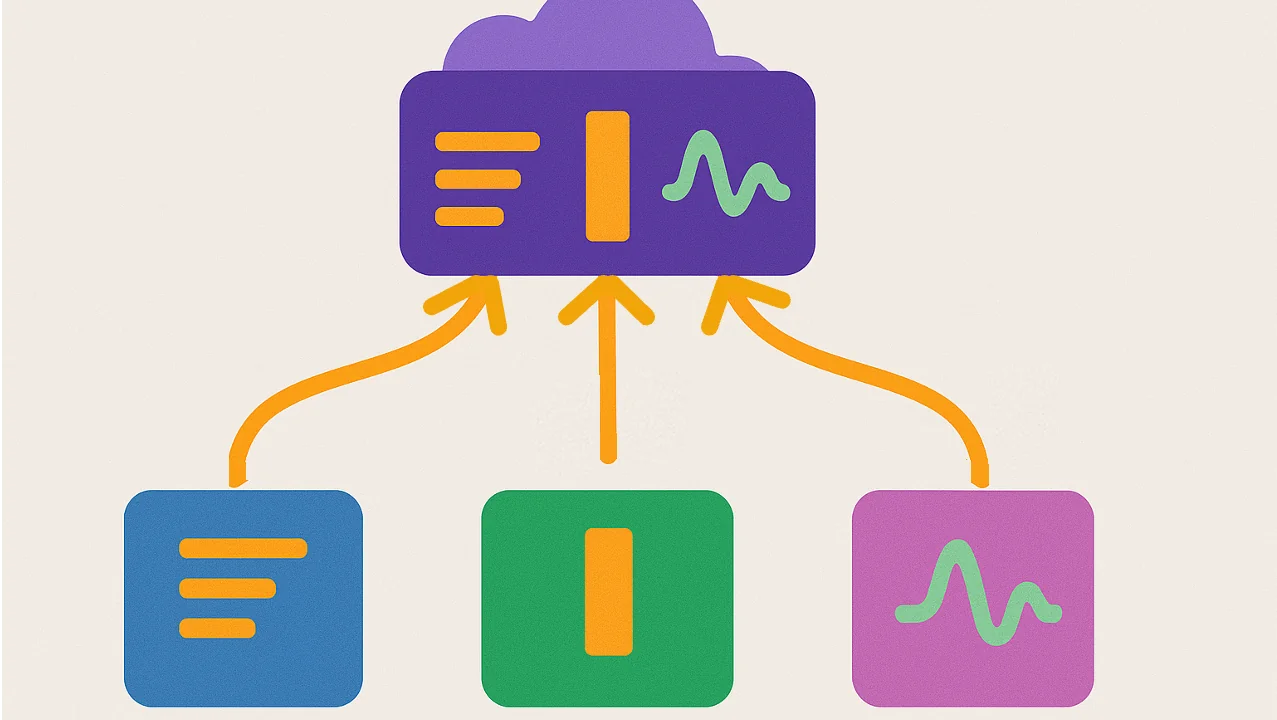
The most fundamental choice is whether to run the OTel Collector as an agent, a gateway, or a combination of both.
- Agent model
Collectors run as sidecars or daemonsets near your application workloads. Ideal for capturing host-level telemetry and reducing dependency on network availability. - Gateway model
Centralized collectors aggregate and process telemetry before exporting it. Good for central processing, batching, enrichment, and applying policies like tail-based sampling.
Best practice: Use agents to collect local telemetry and send it to a gateway for centralized processing and routing.
When should you run the OTel Collector as a sidecar?
The sidecar pattern runs one Collector per pod, alongside the application container. It is the highest-fidelity, highest-cost point on the deployment spectrum: every workload gets its own pipeline, its own resource attribution, and its own failure domain.
Choose the sidecar pattern when:
- You need per-workload isolation. A noisy neighbor on the same node cannot back-pressure your telemetry, and a Collector crash affects exactly one pod.
- You are on constrained runtimes. Serverless container platforms like AWS Fargate and GCP Cloud Run do not expose the node, so a DaemonSet is not an option. The sidecar is the standard Collector deployment there.
- Per-team ownership matters. The team that owns the pod owns the Collector config, without coordinating with a platform team.
Avoid it when node-level collection is enough. A DaemonSet agent covers most Kubernetes log and metric collection at a fraction of the resource overhead, since sidecars multiply Collector instances by pod count rather than node count. The common compromise: DaemonSet agents by default, sidecars only for workloads that need isolation or run on serverless.
How do you deploy the OTel Collector at the edge?
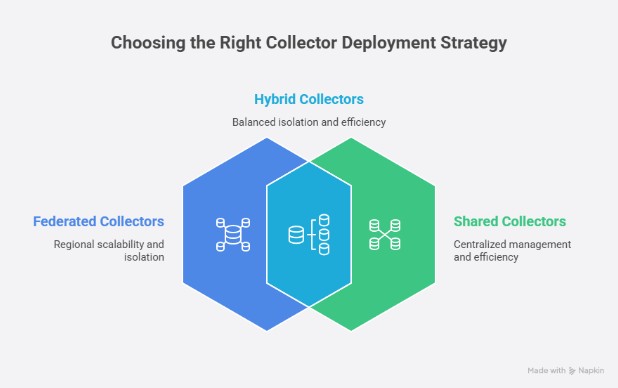
Edge deployment puts collectors close to where telemetry is generated: per region, per cluster, or per zone, forwarding to upstream gateways. This is sometimes called a federated pattern, and it improves:
- Scalability: horizontal scaling across regions or zones instead of one central choke point.
- Latency: the first processing hop is local, cutting round-trip time before data crosses regions.
- Blast radius control: a misconfiguration or overload in one region stays in that region.
Edge collectors are also where telemetry shaping should happen. Filtering, sampling decisions, and distillation applied at the edge govern data shape before downstream indexing and storage costs accumulate. The layered version of this pattern (edge agent, then load balancer, then a stateful gateway tier for tail sampling) is covered in the advanced patterns section below.
Shared vs Dedicated Collectors: Tenancy Trade-offs
In shared environments (e.g., centralized observability teams), you may operate multi-tenant collectors that handle traffic from many services or teams.
- Shared collectors are easier to manage but increase risk if misconfigured (e.g., a noisy tenant can cause overload).
- Dedicated collectors provide stronger isolation and performance predictability, but require more resources and coordination.
Hybrid OTel Collector Patterns
One hybrid pattern: run shared collectors for legacy or vendor-specific traffic (e.g., Datadog receivers and exporters) during migration, while using dedicated collectors for modern OTel-native telemetry. Another pattern we’re seeing is assignment of a dedicated collector to a product team (under their control) that understands the specific needs of their application or component, to then be fed into a centralized collector.
Protecting Your Observability Backends
OpenTelemetry Collectors act as a buffer and policy enforcement layer, helping protect observability platforms from:
- High-cardinality metric floods
- Trace spikes
- Log ingestion storms
With the right configuration, they can batch, throttle, and drop low-value telemetry before it reaches costly backends like Datadog or New Relic — reducing risk and spend.
Load-Balanced Gateway Collectors
For higher availability and throughput, run multiple gateway collectors behind a load balancer. This pattern:
- Enables horizontal scaling
- Reduces risk of single-point failure
- Improves throughput and resilience
Ensure collectors are stateless where possible, or use consistent hashing or sticky sessions when stateful processors (e.g., tail-based sampling) are involved.
Kubernetes Deployment Options
In Kubernetes, the OTel Collector can be deployed in several ways:
- DaemonSet: Ideal for agent mode. Collects node-local logs/metrics.
- Deployment: Used for gateway collectors with horizontal scaling.
- Sidecar: Per-pod agent model, gives high-fidelity context, and applicable to serverless deployments like AWS Fargate or GCP Cloud Run
- StatefulSet: For collectors with stateful processors (e.g., tail-sampling, spanmetrics).
Use readiness probes, resource limits, and anti-affinity rules to ensure stability and isolation.
Self-Monitoring and Telemetry of OTel Collectors
OpenTelemetry Collectors can monitor themselves by exporting internal metrics like:
- Pipeline throughput and drop counts
- Exporter latency and failure rates
- Processor queue lengths
Configure a metrics receiver and exporter (e.g., Prometheus) to scrape and visualize these stats. It’s essential for debugging, tuning, and autoscaling.
Security and Authentication
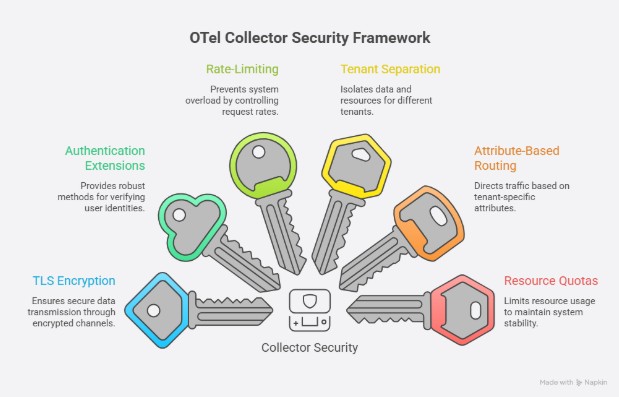
Security considerations include:
- TLS encryption for all ingress and egress traffic
- Authentication extensions (e.g., basic auth, mTLS, OIDC)
- Rate-limiting and circuit breaking to prevent misuse
- Tenant separation using headers or attributes
For multi-tenant collectors, enforce strict attribute-based routing and resource-level quotas.
Advanced Patterns: Layering, Sampling, and Spanmetrics
For high-scale deployments:
- Use layered collectors (e.g., edge agent → load balancer → tail-sampling gateway).
- Apply tail-based sampling in centralized collectors to cut APM costs.
- Leverage the spanmetrics connector to convert spans into (RED) metrics for SLO tracking.
- Use batch and memory_limiter processors to reduce backpressure and crashes.
Some components (like the tail_sampling processor and spanmetrics connector) are stateful and may require more memory and coordination across replicas.
Final Thoughts on OTel Collector Architecture
By thoughtfully designing your deployment architecture, you control where telemetry flows. The next question is what your pipeline keeps: sampling and filtering policies decide which signals survive, and for AI-generated and AI-dependent code, the defaults drop the failures that matter. See our guide to OTel Collector sampling strategies for LLM telemetry.
Need help with your OpenTelemetry Collector rollout?
ControlTheory helps teams design scalable, cost-effective observability controls. Get in touch or check out our guide to reducing observability bloat.
FAQs – Opentelemetry Collector Architecture
An OpenTelemetry Collector is a vendor-agnostic service designed to receive telemetry from applications and infrastructure, process it through configurable pipelines, and export it to one or multiple destinations. It is commonly used to offload delivery concerns (retries, batching, routing, policy enforcement) from applications and to standardize telemetry handling across environments.
The OpenTelemetry Collector architecture is organized around pipelines that transform incoming telemetry into outbound signals, using modular Opentelemetry components.
- Receivers: ingress boundaries (e.g., OTLP, Prometheus)
- OTel Processors: transformations (batching, sampling, resource enrichment)
- OTel Exporters: egress boundaries (backends, queues, protocols)
- Connectors: link pipelines as receiver+exporter hybrids
- Telemetry pipeline: explicit wiring of component instances by signal type
- Extensible design supports custom components (OTel Extension) when needed
In deployment discussions, “agent” and “gateway” describe where the opentelemetry collector runs and what responsibilities it assumes.
- Agent model: runs close to workloads (DaemonSet/sidecar), prioritizing locality
- Gateway model: centralized tier for batching, enrichment, and policy controls
- Gateways are often preferred for tail-based sampling and routing decisions
- Agents reduce dependence on network availability for initial capture
- A common pattern is agent → gateway for layered control
In a federated deployment, “edge” or regional collectors perform first-stage aggregation and then forward to upstream gateways. The primary rationale is architectural: regional isolation, reduced latency to the first processing hop, and improved scalability in multi-cluster or multi-region environments, while still retaining centralized policy enforcement upstream.
For Kubernetes deployment, DaemonSet and sidecar represent different locality and ownership boundaries.
- DaemonSet: one collector per node; efficient for node-local logs/metrics collection
- Sidecar: one collector per pod; maximizes workload context and isolation
- Deployment: typical for gateway collectors; horizontally scalable replicas
- StatefulSet: relevant when processors/connectors are stateful (e.g., tail sampling)
- Sidecars can be useful in constrained runtimes (e.g., serverless-style pods such as “AWS Fargate” and others)
- DaemonSets simplify fleet-wide rollout but concentrate multi-tenant risk per node
- Readiness probes, limits, and anti-affinity materially affect stability
Shared collectors are easier to standardize and operate, but they can fail in disproportionately coupled ways when one tenant generates excessive volume or when routing is misconfigured. Dedicated collectors strengthen isolation and predictability, and many organizations adopt a hybrid: team-scoped collectors feeding into centralized gateways that apply uniform policy and export controls.
An OpenTelemetry exporter is the component responsible for sending telemetry out of an OpenTelemetry pipeline to a destination—either to an OpenTelemetry Collector (common in production) or directly to an observability backend (e.g., tracing/metrics/logs storage and analysis systems).
How it works:
- In an SDK (in-process), an exporter takes telemetry produced by instrumentation and the SDK (spans, metric data points, log records), encodes it into a target protocol/format (most commonly OTLP over gRPC or HTTP), and transmits it to a configured endpoint. SDK exporters are typically invoked by the SDK’s processing loop (often with batching) and may implement retry/backoff depending on the exporter and language SDK behavior.
- In the OpenTelemetry Collector, an exporter is a pipeline component placed after receivers and processors. The OTel Collector’s configuration explicitly wires pipelines as receivers → processors → exporters, and the exporter defines the egress boundary for that pipeline (one-to-many export is a first-class pattern).
- Transport and reliability semantics depend on the exporter. For example, the OTLP exporter has specified configuration expectations and retry behavior in the OpenTelemetry specification, while some exporters are push-based and others are pull-oriented (Prometheus is the canonical “scrape” model).
A Collector mediates between telemetry producers and backends by providing batching, rate controls, sampling, and other policy enforcement mechanisms. This is particularly important under high-cardinality conditions, where uncontrolled ingestion can destabilize downstream platforms and create abrupt cost escalation; pipeline-level control shifts these decisions earlier, where they are operationally meaningful.
ControlTheory closes the runtime feedback loop on top of your Collector deployment, whichever pattern you run.
- Distillation at the edge: Dstl8 distills logs close to where they are generated, so data shape is governed before downstream indexing and storage costs accumulate.
- Content-level detection: Dstl8 reads the actual content of every log line, not just its status code, surfacing emergent patterns that deployment-layer sampling and filtering cannot see.
- Agent-ready context: the Möbius agent correlates signals across your deployment chain and streams runtime context back into Claude Code, Cursor, and Codex, so what code does in production improves what gets shipped next.
Try it against your own Collector: brew install control-theory/dstl8/dstl8 && dstl8 setup
Table of Contents
Where Your OTel Pipeline Loses Signal
Sampling, filtering, and transforming all decide in advance what to drop. Where each one loses signal, what it costs, and how to cut the bill without losing the unknowns.
 Back
Back


press@controltheory.com