


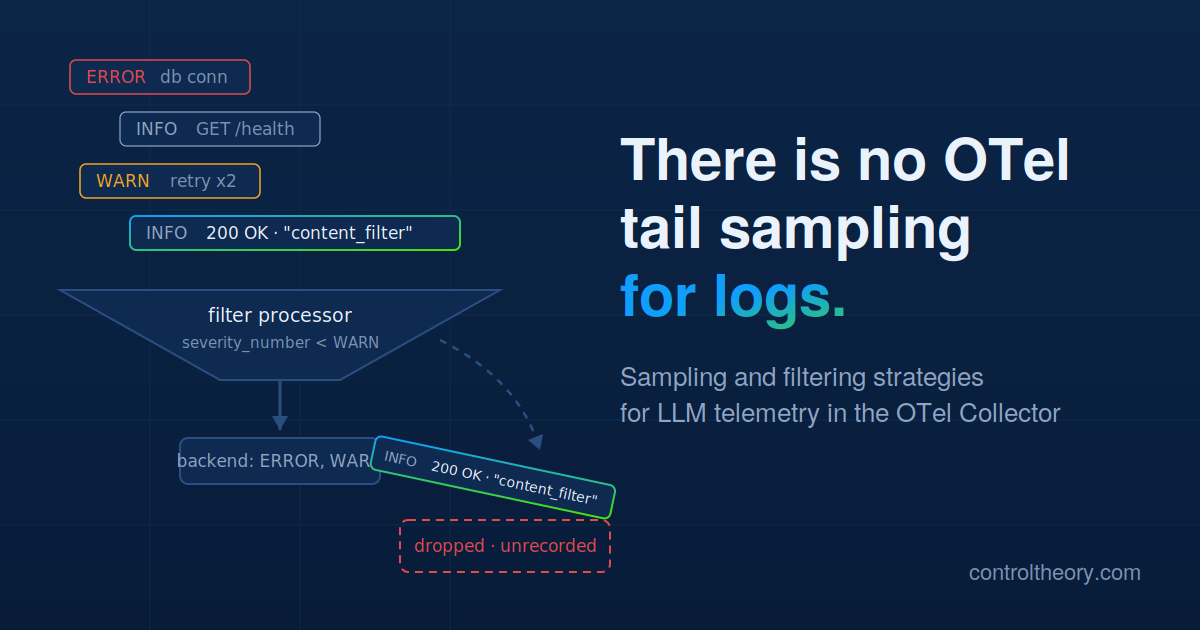
TL;DR: There is no tail sampling for logs. The OTel Collector’s tail_sampling processor is traces only; log volume is controlled by the filter processor and the probabilistic sampler, and the standard cost config (drop everything below WARN) deletes exactly the records where LLM failures live.
LLM failures return HTTP 200 and log at INFO, because nothing threw. If you filter at all: scope severity filters to exclude LLM streams, never truncate LLM log bodies, thin probabilistically only as a last resort, and verify what survives. Or skip the rule-writing: distillation reads every log line and turns volume into signal without deciding deletions in advance.
If you run LLM calls in production and an OTel Collector in front of your logging backend, your filter config is probably built for a world where failures announce themselves. AI-generated and AI-dependent code doesn’t fail that way. It fails quietly: 200 OK, valid-looking JSON, wrong content. And the only durable record of that failure is a log line your severity filter classifies as noise.
Where do LLM failures actually show up?
In log bodies, at INFO. Consider what a quiet LLM failure produces:
| Signal | What your pipeline sees |
|---|---|
| HTTP status | 200. The API call succeeded. |
| Log severity | INFO. Nothing threw, so nothing logged at ERROR. |
| Response body | A refusal, a content-filter block, JSON truncated at the token limit, or a confidently wrong answer. |
The evidence is in the third row, and only in the third row. The refusal text, the "finish_reason": "length", the malformed JSON: these live in the body of an INFO-level log record. Status and severity, the two fields every volume-control config keys on, both say healthy.
How does the OTel Collector control log volume?
Three mechanisms, and it matters which one you use:
The filter processor drops log records matching OTTL conditions: severity thresholds, attribute matches, body pattern matches. This is where most log cost control happens.
The probabilistic sampler processor keeps a fixed percentage of log records. Unlike the filter processor, it’s content-blind by design: it thins volume evenly instead of deciding which records matter.
The transform processor can truncate or strip fields to cut bytes per record.
Note what’s absent: tail sampling. The tail_sampling processor operates on traces only. There is no equivalent that buffers related log records and makes a keep decision after seeing the whole story. Every log-level decision is made record by record, on whatever that one record shows. For the trace side of this problem, see our guide to tail sampling with the OTel Collector.
Why does severity-based filtering drop LLM failures?
Because it encodes an assumption that failures log loudly. Here’s the standard cost config, dropping everything below WARN:
processors:
  filter/drop-low-severity:
    error_mode: ignore
    log_conditions:
      - log.severity_number < SEVERITY_NUMBER_WARN
On the OTel severity scale, TRACE is 1-4, DEBUG is 5-8, INFO is 9-12, and WARN starts at 13. So this config drops every INFO record, which for human-written code is a reasonable trade: the failures you care about logged at ERROR anyway.
LLM calls break that assumption. The request completed, the client library logged the round trip at INFO, and the failure is in the payload. This filter deletes the record before any backend, any alert, or any agent ever sees it. The failure isn’t just unnoticed. It’s unrecorded. Quiet by construction, not by accident.
Can’t I just pattern-match the log bodies?
Partially, and it’s worth doing. OTTL can match against body content, so you can carve known failure signatures out of a severity filter:
processors:
  filter/drop-low-severity:
    error_mode: ignore
    log_conditions:
      - log.severity_number < SEVERITY_NUMBER_WARN and not IsMatch(log.body, "(finish_reason|content_filter|max_tokens|refus)")
Now INFO records mentioning truncation or filtering survive the cut. Do this today if you run severity filters near LLM traffic.
But be clear about what it is: a list of failures you already anticipated. A regex keeps the record when the model says content_filter. It does nothing for the response that’s fluent, well-formed, and wrong, or for the failure mode that didn’t exist when you wrote the rule. Consider a benign prompt that trips a provider’s moderation filter on one deployment and sails through on another: nondeterministic, per-endpoint, invisible to any single log line. No rule anticipates that, and no record-by-record filter can see it, because the signal is a pattern across the stream, not a string inside one body. Pattern matching at the collector encodes known failure modes. The defining property of AI-generated code is that its failure modes are emergent.
How do you filter logs without destroying LLM evidence?
If you’re going to filter, these are the damage-control rules. Note what they have in common: none of them decides which records matter. They just stop the config from deleting evidence.
1. Scope severity filters by service, not globally. Exempt the streams that carry LLM request/response content:
processors:
  filter/drop-low-severity-except-llm:
    error_mode: ignore
    log_conditions:
      - log.severity_number < SEVERITY_NUMBER_WARN and resource.attributes["service.name"] != "llm-gateway"
Severity remains a fine axis for your nginx access logs. It’s the wrong axis for anything that logs model responses.
2. Never truncate bodies on LLM streams. Byte-cutting transforms that trim log bodies destroy the same evidence dropping the record would. A truncated body of a truncated response is nothing.
3. If you must cut LLM log volume with no better destination, thin probabilistically rather than by severity. A probabilistic sampler keeping 25% at least retains a representative slice of quiet failures; a severity filter on the same stream retains zero, because they all log at INFO. But know the cost: a failure pattern occurring in 1% of requests becomes four times rarer in your retained data at 25% sampling. Blind thinning is better than precise deletion of the wrong records, and both are worse than not deleting. Treat this rule as the tell that your volume problem wants a different solution, not a better percentage.
The fourth option isn’t a filtering rule, it’s a different bargain entirely: distillation reads every log line and compresses the stream into signal (patterns, sentiment, anomalies) instead of deciding deletions in advance. No rule to write, no evidence traded for cost. That’s the last section of this post.
How do you verify what your pipeline actually keeps?
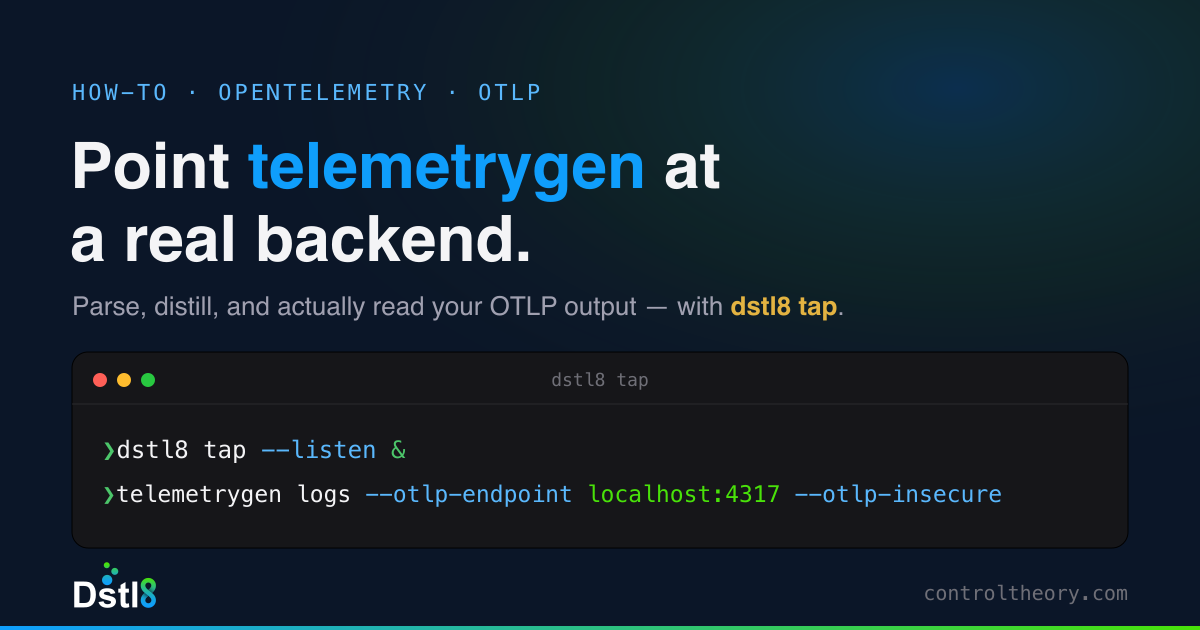
Filter configs fail silently too, and a filter that’s dropping your LLM failures produces no signal that it’s doing so. The fastest check is to point the pipeline at something you can read. Install dstl8, then run dstl8 tap as a local OTLP destination:
brew install control-theory/dstl8/dstl8 && dstl8 setup
Start the receiver with dstl8 tap --listen &, point your collector’s OTLP exporter at localhost:4317, replay traffic through your real filter chain (synthetic works: see pointing telemetrygen at dstl8 tap), and read what survived in dstl8 tui. If the INFO-level records carrying response content aren’t in the distilled output, your filters are eating them, and now you know before an incident teaches you.
Do you still need to sample and filter logs in the OTel Collector?
Maybe not, and it’s worth asking why you’re doing it before tuning how. Sampling and filtering exist to make log volume affordable. They buy that affordability by deciding, in advance, what gets deleted: a severity threshold, a percentage, a regex. Every rule above makes those decisions safer for LLM telemetry. None of them changes the bargain. You’re still trading evidence for cost, and the rules only protect against failures someone thought to write down.
Distillation inverts the bargain. Dstl8 is built from the OpenTelemetry Collector, so your pipeline points at it the way it points at any OTLP destination, and instead of deciding what to delete, it reads every log line and compresses the stream into signal: patterns grouped, sentiment scored, anomalies surfaced, including the cross-stream ones no record-level rule can see. Dstl8 reads the actual content of every log line, not just its status code. The volume problem gets solved at the same place in the pipeline, without the foresight requirement, because continuous distillation turns every log into signal rather than choosing which logs to keep.
What stays yours to configure shrinks to the easy part: dropping pure garbage (health-check spam, debug floods you’ll never want) at the edge. The hard part, deciding which INFO-level record is the one that mattered, stops being a config decision at all. For what hides in that layer, see The Engineer’s Guide to Invisible LLM Failures.
Watch it, then run it on your stack
Pick where you already work:
LOG SEVERITY
LOGS
IMPACTED RESOURCES
SUMMARY
Run it on your cluster:
Run it in one terminal:
Run it in your editor:
Ready to see what your filters are hiding? → OpenTelemetry Log Analysis →
Table of Contents
Runtime Feedback for Agentic Engineers
Catch OTel, K8s, LLM, agentic patterns from AI-generated code - fed directly back to your agent.
 Back
Back


press@controltheory.com