



Codex · MCP · Async Agents · Parallel Tasks · PR Review
Codex Closed the Loop from Task to PR.
Dstl8 Closes the Loop from PR to Runtime.
Codex runs autonomously in ephemeral sandboxes. It reads the task, writes the code, runs tests in isolation, ships a pull request, and moves on. Ten tasks can run in parallel before you finish a code review. The sandbox is not your production. The PR review is often another Codex run.
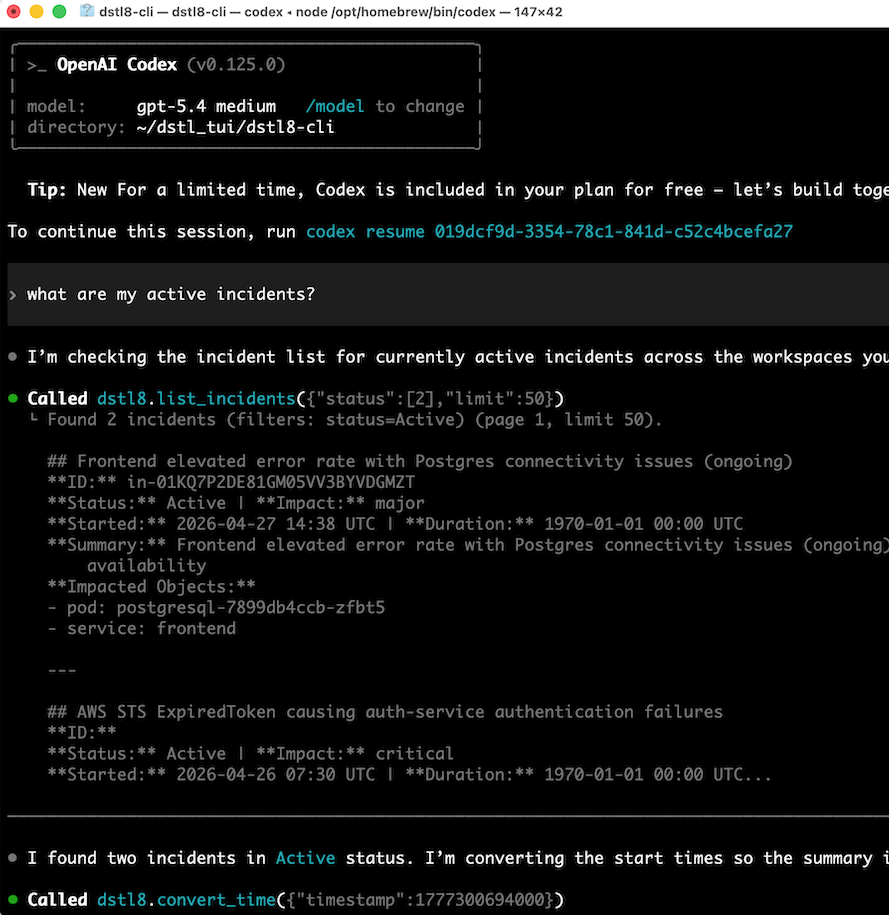
Dstl8 reads your live logs, finds the pattern a merged PR produced, names the cause, and exposes it to Codex through a native MCP server. Add Dstl8 to ~/.codex/config.toml and every Codex task can query your runtime logs directly, the same way it reads a file or runs a test. Every next prompt is grounded in what your code actually did in staging, preview, or production, not in what the sandbox allowed.
brew install control-theory/dstl8/dstl8
10
CODEX TASKS THAT CAN RUN IN PARALLEL BEFORE YOU REVIEW THE FIRST PR
Ephemeral
CODEX’S SANDBOX STATE WHEN IT DECLARES “TESTS PASSING”
1
INCIDENT VIEW ACROSS EVERY PR IN A PARALLEL TASK BATCH
4–8 hrs
MANUAL TIME TO TRACE AN ASYNC-SHIPPED REGRESSION TO ROOT CAUSE
2 min
FROM brew install gonzo TO FIRST USABLE STREAM
Six failure modes
Six Ways Codex’s Async Model Breaks the Feedback Loop.
Codex did not break the SDLC. It detached it. Tasks run in parallel, in the cloud, in sandboxes that do not know your production. PRs land in a queue. Reviewers (human or agent) read diffs without runtime context. These six failure modes come with the async delegation model itself. They do not get patched by a stricter prompt. What changes is whether you find them before your users do.
01
You delegated ten tasks. You are reviewing three PRs at once.
Codex’s parallel cloud model means you can kick off ten tasks and come back to a queue. The batch lands together. Each PR is a self-contained diff the agent believes is correct. You are now a reviewer for ten independent reasoning streams, most of them completed while you were in a meeting. Whichever one introduced the runtime regression, production tells you first.
# monday morning delegation
tasks queued: 10
parallel sandboxes: 10
prs opened: 10
avg review time: ~6 min per pr
prs merged today: 7
runtime regression: 1
which pr caused it: ???
02
The sandbox Codex tested in has none of your production state.
Codex runs each task in an ephemeral container. Environment variables are synthetic. RLS policies are not applied. Third-party API quirks are absent. Production data shapes, real queue depth, your custom middleware, the actual network topology: none of it is in the sandbox. “Tests passing” is a statement about a clean room. Whether the code works against your live system is a different question, answered only after deploy.
# codex sandbox
DATABASE_URL=postgres://localhost:5432/sandbox_db
STRIPE_KEY=sk_test_synthetic
RLS_ENABLED=false
FEATURE_FLAGS=all_default
✓ 147 tests passing
✓ “task complete, pr opened”
# production
DATABASE_URL=postgres://prod-primary/app
STRIPE_KEY=sk_live_…
RLS_ENABLED=true
FEATURE_FLAGS=real_tenant_config
✗ 22 × TypeError: Cannot read properties of undefined (‘metadata’)
03
Codex reviewed the Codex PR. No human was in the loop.
Teams wire Codex into PR review for the obvious reason: velocity. The same agent family that wrote the task can also read the diff and approve it. When that review passes, the PR merges. The approver is shaped by the same training data and the same constraints as the author. It is not a substitute for a human reading the diff. It is not a runtime check. The code ships having been seen by agents and nobody else.
pr #4721: refactor stripe webhook idempotency
author: codex-cloud (task a3f2)
reviewer: codex-review-bot
verdict: approved · tests passing
merged: saturday 02:14
first human to read this code: the on-call engineer, 08:46
04
The PR shows the final state. The iterations inside the sandbox are gone.
A Codex task retries. It edits files, runs tests, reads output, edits again, concludes. The PR is the last state. The intermediate reasoning, the approach that got abandoned in attempt four, the assumption carried into attempt six, none of it is in the commit history. The diff is the outcome. The chain of decisions that produced it is not recoverable.
# what the pr shows
2e8b4a1 fix: handle missing metadata in webhook handler
# what happened inside the sandbox
attempt 1: read schema, edit webhook.js (tests: 2 failing)
attempt 3: assumed metadata.userId on all events (tests: 1 failing)
attempt 5: added try/catch, swallowed error (tests: passing)
attempt 7: refactored around the catch (tests: passing)
commit: final state only
05
The task you delegated Monday produced the regression that appeared Thursday.
Async delegation has a latency problem. You delegated a task. It shipped a PR. The PR merged. Three days later, a cron job fires under a condition that only shows up weekly, and runtime breaks. By the time the failure surfaces, the context of why you kicked off that task in the first place is cold. The task list scrolled past. Correlating the incident to the delegation is a manual Git spelunking exercise.
mon 09:12 codex task delegated: “add webhook retry logic”
mon 14:03 pr #4689 merged · codex-reviewed · tests green
tue 08:00 codex task delegated: “refactor queue worker”
tue 17:45 pr #4702 merged · codex-reviewed · tests green
wed 11:30 3 more tasks queued, merged, forgotten
thu 02:17 cron fires weekly billing reconciliation
thu 02:19 failure in queue worker · “couldn’t have been my code”
# which delegation caused it? the task list does not remember.
06
Codex never reads the production signal that would make the fix correct.
You prompt Codex to fix a bug. It reads the source, the tests, the error message you pasted. It does not read your live runtime. It does not see the incident pattern in the last six hours, the correlated deploy event, or the specific payloads that triggered the failure. The sandbox spins up, tests run, the PR opens. Every fix is a guess against the tests, not a fix against the runtime.
# what the codex task reads
→ repo files (source + tests)
→ the error message in your prompt
→ files in the sandbox working tree
# what it does not read, by default
✗ the active incident in any deployed environment
✗ the error pattern across the last 6 hours
✗ the deploy that shipped the regression
✗ correlated infrastructure events
✗ what’s actually happening at runtime right now
# the fix is written against half the picture.
WHY THIS MATTERS
Claude Code compressed the SDLC inside a single session. Codex did something different. It detached delegation from review, and review from runtime. Tasks run in parallel. Sandboxes are synthetic. PRs get approved by agents. By the time a regression surfaces, the task that shipped it is three days and forty delegations ago. The speed is real. The feedback loop is not closed. Every next Codex task is delegated against the same stale picture of what actually happens across your deployed environments.
The solution
How Codex Teams Close the Loop from PR to Runtime.
The goal is not another dashboard. The goal is an agent that watches the runtime Codex cannot see, correlates what it finds, names the cause, and makes that answer available inside Codex as a callable tool. Dstl8 does the first hour of triage before you open the PR queue. The MCP server makes that triage something Codex itself can do, inline, during any task.
Dstl8 watches the runtime Codex’s sandbox cannot reach
Dstl8 monitors your live log streams for emerging failure patterns after every Codex-merged PR. When the task said “done” and runtime disagrees, the pattern surfaces in minutes, not in the support ticket filed three days later.
One incident view across the parallel PR batch
When Codex ships ten tasks in parallel and seven merge the same morning, Dstl8 flattens the runtime signal into one incident and points to the specific PR that produced it. You stop bisecting the batch and start on the fix.
Root cause narrative with named evidence
Dstl8 writes a short diagnosis: what the PR shipped, what broke in runtime, which signals confirm it, and the first thing to try. Every claim links back to the underlying log entries. You walk into the review with the answer already drafted.
One native Codex integration: the MCP server
Dstl8 exposes an MCP server. Add it to ~/.codex/config.toml and Codex speaks runtime as a first-class tool: incidents, patterns, anomalies, the knowledge graph. Every task can query your runtime logs directly, the same way it reads a file or runs a test. The same config covers Codex CLI, Codex cloud, and the IDE extension. One config block, every Codex surface covered.
Runtime context that compounds across tasks
The incident Dstl8 just resolved, the root cause it named, the correlated deploy, the affected code paths, all of it persists in the knowledge graph. The next Codex task that touches the same service pulls it through the MCP server automatically. Codex stops retrying against what the tests said was broken and starts working against what runtime actually showed, with every lesson the last task learned already loaded.
What you get
How Codex Teams Ship Faster Without Meeting Their Code in Production.
MÖBIUS
Proactive root cause analysis, with receipts.
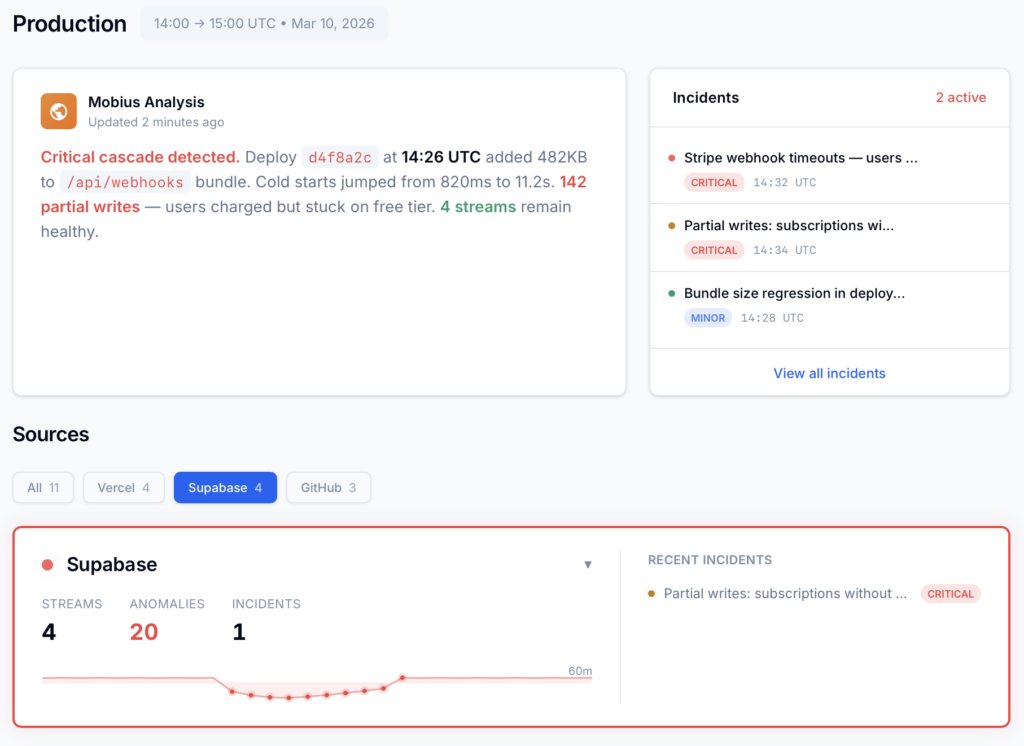
Dstl8 watches your runtime continuously, clusters related failures into incidents, names the likely cause, and cites the exact log lines that support the diagnosis. By the time your PR queue from overnight lands, the investigation is already drafted. Ask follow-ups from Codex or your terminal without switching contexts.
MCP
Codex queries your runtime through MCP.
Dstl8 runs an MCP server that Codex speaks natively. Add it to ~/.codex/config.toml and any task inherits live runtime access: incidents, patterns, anomalies, the knowledge graph. Your runtime logs become a first-class input for Codex, not a screenshot pasted into a prompt. “What’s the current error pattern on checkout-flow,” “show me the last incident’s root cause,” “was yesterday’s deploy clean.” Every answer is structured, grounded in your real data, and citable back to the underlying log entries. One config, every Codex surface (CLI, cloud, IDE) covered.
KNOWLEDGE GRAPH
Runtime memory that compounds across Codex tasks.
Every incident Dstl8 resolves lands in the knowledge graph: the pattern, the root cause, the deploy that shipped it, the code path that failed, the fix that resolved it. The next Codex task that touches the same service pulls this through the MCP server automatically. On day one you get the runtime signal. By month three, every delegation inherits everything the previous ones learned. The higher your task volume, the more the graph earns its keep.
CORRELATION
Faster answers when “which merged PR broke prod” is the symptom, not the cause.
1 incident view across the parallel PR batch
The question stops being “which of the seven PRs we merged this morning introduced the regression?” and becomes “what pattern is Dstl8 seeing, and in which code path?” Dstl8 correlates the runtime failure to the PR that shipped it and ranks what is actually broken.
INCIDENTS
One incident list across every Codex task the team delegates.
You don’t need another isolated log viewer. You need one list of active incidents, grouped by related signal, ranked by impact, with enough context to tell whether the failure came from one engineer’s cloud task or from a batch of five that merged overnight. Dstl8 does that ranking continuously. The top of the list is the thing worth fixing.
CONTINUOUS
Runtime feedback across the whole review cycle.
When Codex opens a PR, the preview deploy fires. When the PR merges, the staging or production deploy fires. Dstl8 watches all of it. Always-on pattern detection flags the moment a new deploy behaves differently from its baseline, whether that’s a Vercel preview, a Railway staging service, or production. Dstl8 writes the root cause the moment the signal is conclusive. You keep the velocity of async delegation and catch regressions in the preview environment, before they ever reach prod.
Get Started
Start with terminal-native streaming in the same terminal your Codex CLI runs in.
2 min to first usable stream
Use Gonzo to tail Vercel, Railway, Supabase, CloudWatch, or any log source that writes to stdout or an API. Timestamps in your local zone, flexible filters, AI-powered summarization on demand. Bring in Dstl8 when you want proactive detection, cross-task correlation, and in-agent Q&A against your full runtime surface.
Your options
Codex Runtime Debugging: How Teams Actually Solve This.
Capability
Catches runtime failure from async-merged Codex PR
Correlates failure to the specific PR in a parallel batch
Surfaces what happened inside the ephemeral sandbox
Live runtime query from inside a Codex task
Cross-task runtime memory
Ranked incidents by real user impact
MANUAL REVIEW
AI CODING TEAMS TODAY
ControlTheory
Common questions
Codex Runtime Debugging — Questions from Engineering Teams.
Get started
Install & Configure Dstl8 in Under 2 Minutes.
Try the Dstl8 CLI and TUI for continuous runtime feedback. Install it, add sources, connect the MCP server into Claude Code, and more.
brew install control-theory/dstl8/dstl8
dstl8 signup
curl -fsSL https://install.dstl8.ai/script/dstl8-cli | shnpx dstl8nix run github:control-theory/dstl8Download from https://github.com/control-theory/dstl8/releasesQuick Start
# 1. Install the CLI
brew install control-theory/dstl8/dstl8

# 2. Create a Dstl8 account (or `dstl8 login` if you already have one)
dstl8 signup

# 3. Add a source so logs flow in
dstl8 sources add vercel

# 4. Connect your AI agent, auto-detects MCP-compatible clients on your machine and configures them
dstl8 install --all
dstl8 install claude-code
Add Sources
# Add Sources

dstl8 sources add kubernetes
dstl8 sources add cloudwatch
dstl8 sources add vercel
dstl8 sources add supabase
dstl8 sources add otlp
dstl8 sources add github
Start Here
See what’s actually happening.
Connect your deployment chain. Surface emergent patterns. Get root cause analysis with fix recommendations — right in your editor.
↻ Intelligence that compounds — every runtime signal makes the next one sharper.
Dstl8 — Supabase runtime analysis

Open Source
Not ready for Dstl8? Start with Gonzo.
Free, open source log analysis TUI. Real-time charts, pattern detection, AI-powered insights — right in your terminal. No account, no config.
brew install gonzo
Codex ships the PR. Dstl8 closes the loop to runtime.
Stream logs with Gonzo. Let Dstl8 detect, correlate, and diagnose. Add the MCP server to your Codex config and every next task is grounded in what actually happened — not in what the sandbox allowed. No credit card, no sales call.
Related pages
More for AI Code Generation Reliability.
Stop Meeting Codex’s Code in Production.
Let Dstl8 Close the Loop.
Stream logs with Gonzo. Let Dstl8 detect, correlate, and diagnose. Bring runtime into Codex through the MCP server, so every next task is grounded in what actually happened in staging, preview, or production, not in what the sandbox allowed.