



Developer Observability
AI Ships Code Fast. Developer Observability Built to Keep Up.
Observability platforms were built for ops teams who configured them in advance. Dstl8 is the developer observability tool for AI-native teams — runtime visibility across your whole stack, with root cause cited to the exact log line, right in your terminal and IDE.
brew install control-theory/dstl8/dstl8
2 min
From Install to First Insight
50+
Sources, No Agents to Deploy
10x
More Code From AI Coding Tools
1
Log Line Each Root Cause Cites
Zero
Dashboards to Build First
Four failure modes
Four Ways Traditional Observability Fails AI-Native Teams.
AI-generated code multiplies how much your system does and how fast it changes. Observability built for a slower, human-authored world quietly falls behind — usually right when you need it.
01
Dashboards assume you already knew what to watch
You configure panels and alerts for failures you can predict. AI-generated code fails in shapes nobody set up a monitor for, so the first signal is a user complaint, not your tooling.
# dashboard: all panels green
error_rate 0.00% · p99 nominal
# meanwhile, in production
null deref in generated handler
users affected · no alert fired
02
Sampling and ingest caps drop the line that mattered
Cost-control sampling throws away the one request that explains the outage. You either pay to keep everything or lose the evidence — and you find out which after the incident, not before.
# trace sampled at 1%
request_id 9f2c… → dropped
# the failing path
not in retained sample
root cause: unrecoverable
03
Correlation is left as homework for the engineer
Logs in one tool, metrics in another, traces in a third. The dashboard tells you something changed at 02:14. You still stitch the story together by hand, across four tabs, half asleep.
# metrics: latency spike 02:14
# logs: which service? open tab 2
traces: open tab 3 … 4
correlation: manual
04
Instrumenting takes a sprint you do not have
Manual spans, SDK wiring, config sprawl. By the time the stack is fully instrumented, the AI tools have shipped another ten features into the parts you have not covered yet.
# coverage report
instrumented: 38% of services
# new this week (AI-generated)
+14 endpoints · 0 spans
Why should you care?
The productivity gain from AI coding tools is real. So is the visibility gap. The faster your tools ship, the more of your system runs in places your observability never reached — and that is exactly where the next incident starts.
The solution
How Dstl8 Gives Developers Real Runtime Visibility.
The goal is not another dashboard to babysit. It is a developer observability tool that tells you what actually happened, fast enough to act on — in the terminal and IDE where you already work.
See what the running system actually did
Behavior-first, not dashboard-first. Dstl8 shows you the real runtime signal — what executed, what failed, and what changed — without you predicting it in advance.
OpenTelemetry in, no ops team required
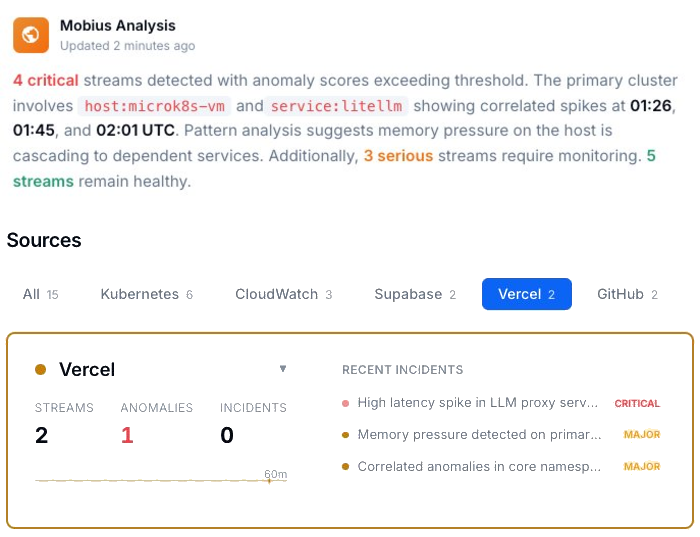
Point your OpenTelemetry collector at Dstl8 or brew install the CLI. 50+ sources — Vercel, Supabase, Kubernetes, AWS, Cloudflare — connect in minutes with no agents to deploy.
Möbius distills 10x volume into the few patterns that matter
Continuous runtime distillation turns the flood of AI-era log volume into the handful of regressions, anomalies, and correlations actually worth your attention.
Root cause cited to the exact log line
Get the answer, not a chart to interpret. Dstl8 hands you what broke, why, and where — delivered to your terminal, IDE, or Slack, cited to the exact evidence.
Correlate app, deploy, auth, and infra in one place
One incident usually spans several layers. Dstl8 brings application logs, deploy events, auth boundaries, and infrastructure together so root cause does not require four tabs.
What you get
What Developer Observability Looks Like When It Works.
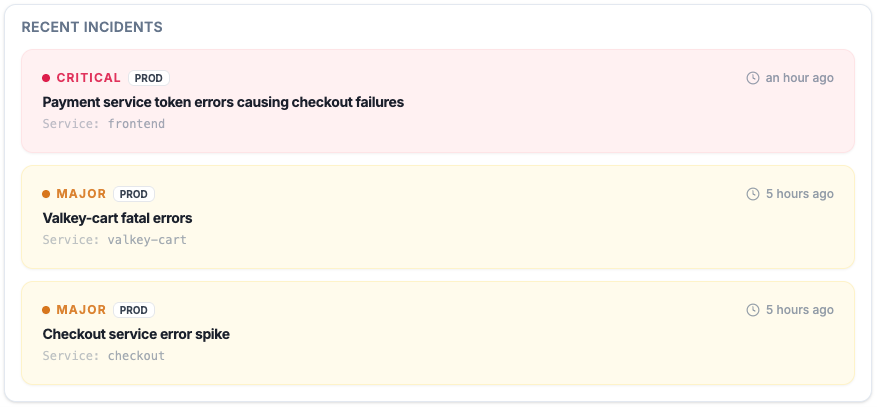
Active Incidents
See which AI-generated failures are real, which are noisy, and which are spreading.
Instead of digging through scattered logs when something breaks in production, you get a prioritized incident view with timestamps, severity, and evidence connected to the runtime.
Code Quality
Improve code quality without slowing down authorship.
24.2% JavaScript snippets affected in one security study
AI-assisted output can be productive and still carry security and reliability debt. Code quality assurance starts after generation, not before it.
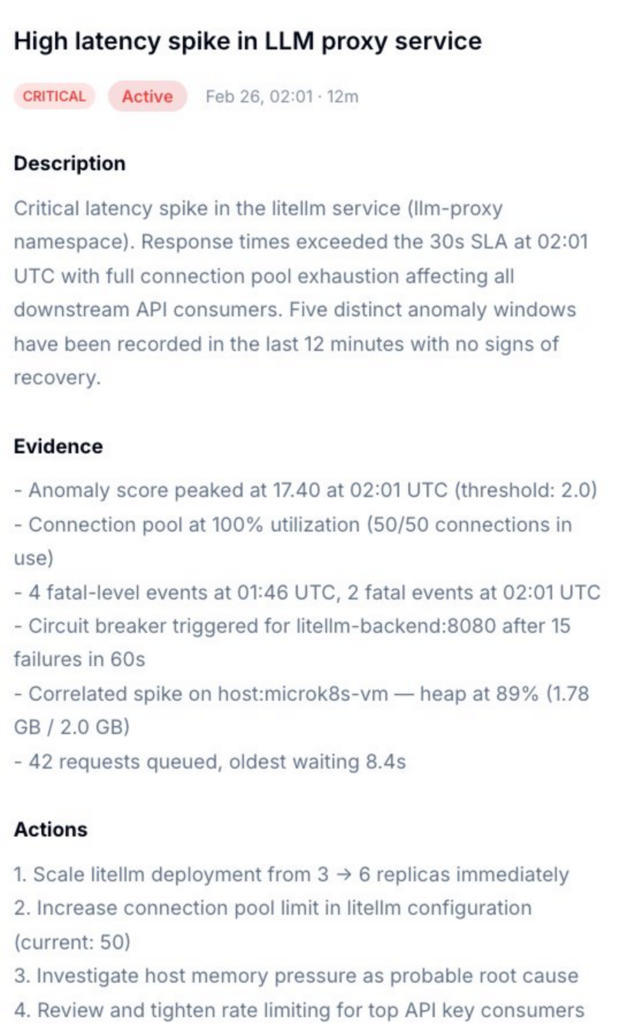
Incident Detail
Root cause, evidence, and next actions in one place.
Get a diagnosis that tells you whether the failure belongs to auth, data shape, environment drift, missing publish artifact, or an actual code path regression from GitHub Copilot code.
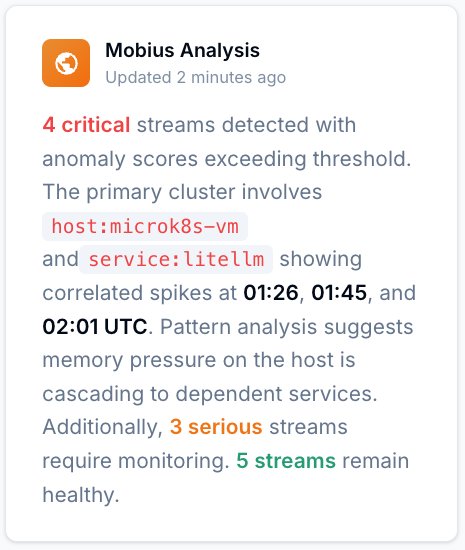
Mobius
Ask what changed, what broke, and what is correlated.
Natural language over real telemetry. Use it to investigate AI-generated services, infra changes, or legacy code touched by AI suggestions without starting from a blank terminal.
Get Started
Start with Gonzo — free, open source, 2 minutes.
2K+ GitHub stars
Use Gonzo to inspect what your AI-generated code is doing in production before you ask for another fix, another review, or another autocomplete.
Observability that answers
Developer Observability: Your Options.
Capability
Runtime visibility without pre-built dashboards
Correlate app, deploy, auth, and infra in one place
Root cause cited to the exact log line
Signal distilled at the source, no ingest tax
Works in your terminal and IDE
Time to first insight
DIY / Manual
Hours
Traditional APM
Prompt by prompt
ControlTheory
2 minutes
Why it’s different
AI Code Debugging Is Not Traditional Debugging.
When you debug code you wrote, you start with a mental model of what it was supposed to do. With AI-generated code, that model doesn’t exist — the failure modes, the signal-to-noise ratio, and the time horizon are all different. Here’s what changes.
You’re debugging unfamiliar code.
You didn’t write it, so you can’t reason from intent. You have to reason from behavior — what the code actually did at runtime, not what it was meant to do.
The failure modes are novel.
AI tools autocomplete against patterns, not against your runtime. Edge Runtime mismatches, hallucinated APIs, and silent type coercion produce failures nobody wrote an alert for.
The volume is 10x.
AI ships more code, more often, generating more log volume. The one line that explains the failure is buried deeper than it has ever been.
Speed of detection matters more.
Code ships in seconds. If detection takes hours, the gap between “shipped” and “found the bug” is where outages live.
Common questions
Developer Observability — Questions from Engineering Teams.
Get started
Install & Configure Dstl8 in Under 2 Minutes.
Try the Dstl8 CLI and TUI for continuous runtime feedback. Install it, add sources, connect the MCP server into Claude Code, and more.
brew install control-theory/dstl8/dstl8
dstl8 signup
curl -fsSL https://install.dstl8.ai/script/dstl8-cli | shnpx dstl8nix run github:control-theory/dstl8Download from https://github.com/control-theory/dstl8/releasesQuick Start
# 1. Install the CLI
brew install control-theory/dstl8/dstl8

# 2. Create a Dstl8 account (or `dstl8 login` if you already have one)
dstl8 signup

# 3. Add a source so logs flow in
dstl8 sources add vercel

# 4. Connect your AI agent, auto-detects MCP-compatible clients on your machine and configures them
dstl8 install --all
dstl8 install claude-code
Add Sources
# Add Sources

dstl8 sources add kubernetes
dstl8 sources add cloudwatch
dstl8 sources add vercel
dstl8 sources add supabase
dstl8 sources add otlp
dstl8 sources add github
Start Here
See what’s actually happening.
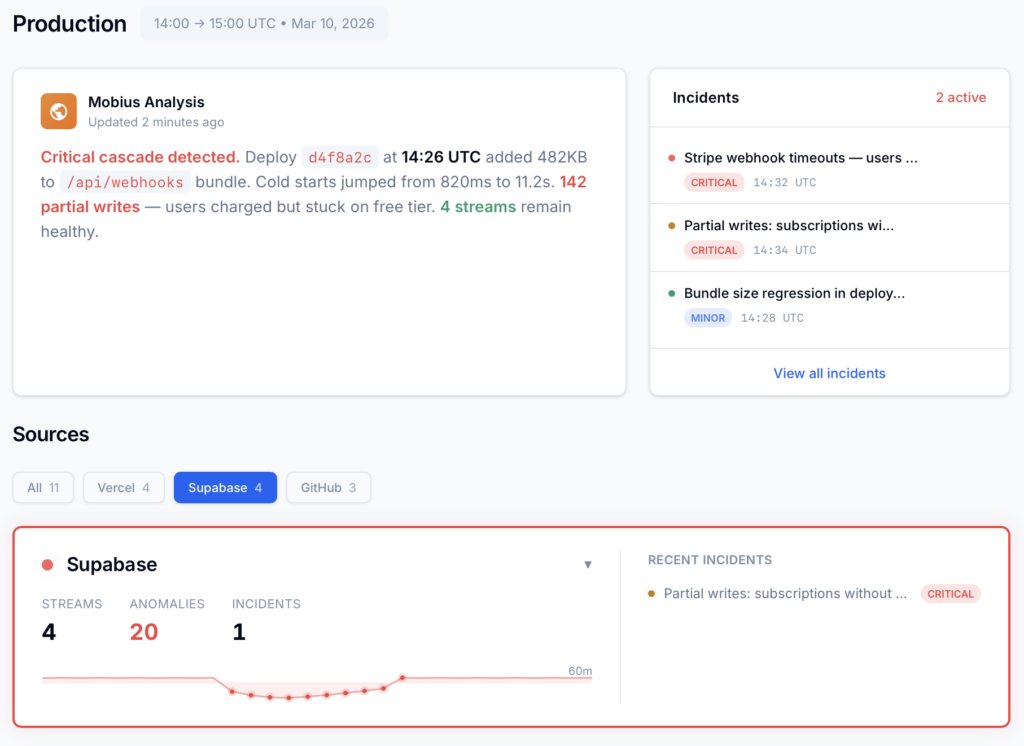
Connect your deployment chain. Surface emergent patterns. Get root cause analysis with fix recommendations — right in your editor.
? Intelligence that compounds — every runtime signal makes the next one sharper.
Dstl8 — Supabase runtime analysis

Open Source
Not ready for Dstl8? Start with Gonzo.
Free, open source log analysis TUI. Real-time charts, pattern detection, AI-powered insights — right in your terminal. No account, no config.
brew install gonzo
See What Your Code Actually Did.
Free account. Gonzo running against your production logs in 2 minutes. Early access to Dstl8. No credit card, no sales call.
Related pages
More on runtime visibility.
Your Tools Ship With Confidence.
Now Observe With Confidence.
Runtime visibility across your whole stack, root cause cited to the log line. Free 14-day trial, no credit card.