


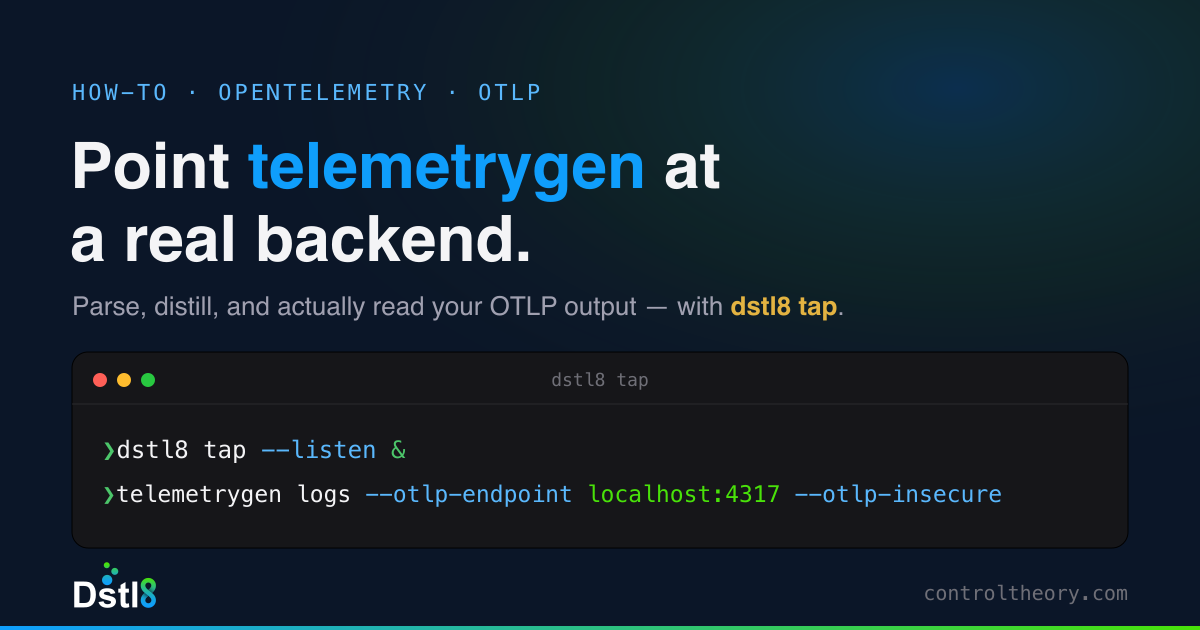
TL;DR — To send telemetrygen output somewhere you can actually read it, start a local OTLP receiver with dstl8 tap --listen &, then run telemetrygen logs --otlp-endpoint localhost:4317 --otlp-insecure. dstl8 tap auto-converts each record to OTLP and streams it to your dstl8 org, where you view it with dstl8 tui. One terminal, no backend to build.
If you’ve used telemetrygen to load-test an OpenTelemetry collector, you know the awkward part: the data goes in, but there’s nowhere good to look. You point it at a debug exporter, or /dev/null, and squint at raw stdout. This guide shows a better target — dstl8 tap, a drop-in local OTLP receiver that parses, distills, and triages the stream so you can see what you generated.
What is telemetrygen?
telemetrygen is a CLI from the OpenTelemetry Collector Contrib project that generates synthetic OTLP telemetry — logs, traces, and metrics — and exports it over gRPC or HTTP. It’s the standard tool for exercising a collector or pipeline without wiring up a real application. Learn more about in this how-to blog “How to Use telemetrygen to feed Telemetry to the OTel Collector.”
What is Dstl8 tap?
dstl8 tap is a universal OTLP ingest tool. It reads log lines from stdin or accepts OTLP directly with --listen, auto-detects the format, converts everything to clean OTLP, and streams it to your dstl8 org — where it’s parsed into streams, severity, and patterns, and surfaced in the dstl8 TUI. For this guide, --listen turns it into a local OTLP receiver that telemetrygen can target.
Prerequisites
- telemetrygen — install with Go:
go install github.com/open-telemetry/opentelemetry-collector-contrib/cmd/telemetrygen@latest - dstl8 — install the CLI and sign up (setup also wires up the AI-agent MCP if you want it):
brew install control-theory/dstl8/dstl8 && dstl8 setup
Send telemetrygen logs to dstl8 tap (step by step)
1. Start the receiver. --listen opens OTLP on gRPC :4317 and HTTP :4318. The & backgrounds it so you can stay in one terminal:
dstl8 tap --listen &
You’ll see it come up:
Tapping logs → otlp source "OTLP demo"
  Listening for OTLP: gRPC localhost:4317 · HTTP localhost:4318
2. Generate logs with telemetrygen at that endpoint:
telemetrygen logs --otlp-endpoint localhost:4317 --otlp-insecure --duration 30s
3. Watch tap receive and forward it. tap reports live stats — every record converted to OTLP and streamed to your org, zero dropped:
tap: 600 read · 600 sent · 0 failed · 44 KiB
4. Read the distilled result in the TUI:
dstl8 tui
Your synthetic stream shows up parsed — severity mapped, log viewer populated, patterns grouped — instead of scrolling past as raw stdout.
Test it first? See the conversion with –dry-run
Want to watch tap convert to OTLP without sending anything? Pipe a file through it:
cat app.log | dstl8 tap --dry-run
It prints the OTLP JSON to your terminal and sends nothing — a quick way to see the parsing before you run tap.
One terminal, not two
The & in step 1 is the trick: it backgrounds the listener so telemetrygen runs in the same shell. If your machine is slow to bind the port, add a one-second pause so the receiver is ready before you generate:
dstl8 tap --listen &
sleep 1
telemetrygen logs --otlp-endpoint localhost:4317 --otlp-insecure --duration 30s
Frequently asked questions
Does telemetrygen support logs?
Yes. telemetrygen has logs, traces, and metrics subcommands. telemetrygen logs generates synthetic OTLP log records, which is what dstl8 tap ingests.
What ports does dstl8 tap –listen use?
The OTLP defaults: gRPC on localhost:4317 and HTTP on localhost:4318. Override them with --listen-grpc-port and --listen-port.
Do I need a dstl8 account?
To send data to your org, yes — run dstl8 setup once (it creates or detects your account). To just see the OTLP conversion locally, use --dry-run, but you still need to install and setup dstl8 via the brew and setup commands.
gRPC or HTTP — how do I use the HTTP endpoint?
telemetrygen defaults to gRPC (:4317). To use HTTP instead, add --otlp-http and point at :4318:
telemetrygen logs --otlp-endpoint localhost:4318 --otlp-http --otlp-insecure
Can I set the service name?
Yes — pass it as a resource attribute on telemetrygen (--otlp-attributes 'service.name="checkout-api"'), or override it on tap with --service checkout-api.
How is this different from pointing telemetrygen at a collector?
A collector receives and forwards — you still need a backend and a place to look. dstl8 tap is the destination that parses and shows the data, so you see the distilled result immediately instead of moving bytes around.
Test telemetrygen on Your Own Collector
You just walked through the manual flow. Here’s the same thing running live — pick a tab and watch your logs get parsed, distilled, and triaged:
Watch it, then run it on your stack
Pick where you already work:
LOG SEVERITY
LOGS
IMPACTED RESOURCES
SUMMARY
Run it on your cluster:
Run it in one terminal:
Run it in your editor:
And the same single line taps your real logs, not just synthetic ones:
kubectl logs -f deploy/api | dstl8 tap --service api
Ready to run it on your own stack? → OpenTelemetry Log Analysis →
Table of Contents
Runtime Feedback Loop for AI-Speed Engineering
Dstl8 distills runtime signal at the source, routes the answer back to the agent or engineer who shipped the code.
 Back
Backpress@controltheory.com