In this blog, we’ll look at some example configurations that can be used to control telemetry flow in a standard OpenTelemetry (OTel) collector. Three scenarios will cover the current 3 main signal types across metrics, logs and traces.
OTel Collector – A Recap
The OTel collector is a powerful piece of software – some might even describe it as the “crown jewel” of the OTel project. Recall that at a high level, the OTel collector has a set of “receivers” that receive incoming telemetry of various types – this could be telemetry emitted from your existing systems/apps, or newer sources such as those that support the OpenTelemetry Protocol (OTLP) for example. Then there are “processors” that perform operations on the telemetry, before being sent to destinations with “exporters” (e.g. an existing observability backend or an S3 bucket). Receivers, processors and exporters are then organized into pipelines (by telemetry type) that are instantiated in the collector – there can be multiple processors (in series) in a pipeline.
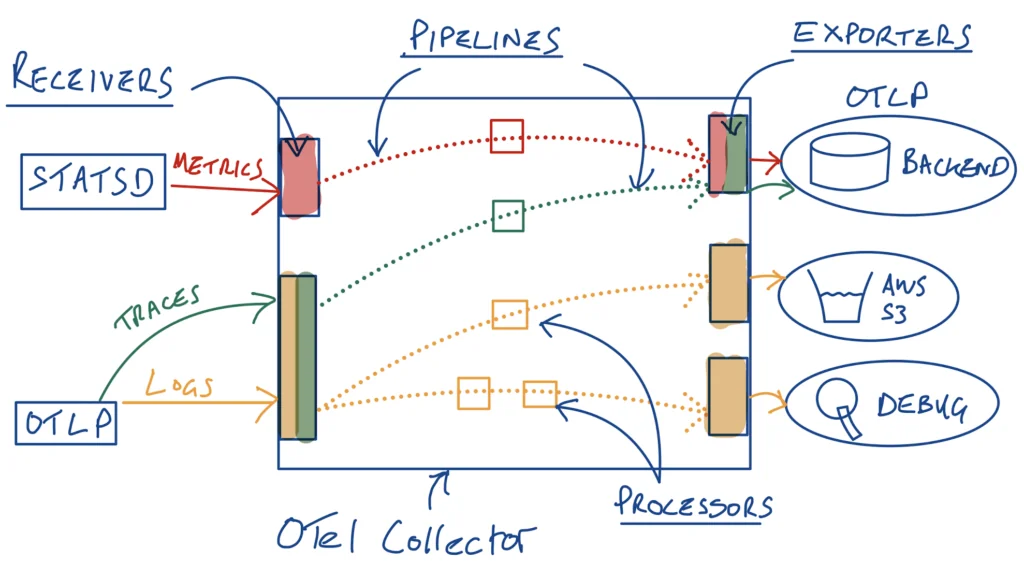
OTel Collector Overview
OTel Signal 1.: Metrics
Let’s begin with metrics. As we talk to folks in the market, metrics and in particular “custom metrics” are commonly adopted signals that can contribute significant value to measuring service health. The problem is that as these custom metrics are adopted by engineering teams, metric volumes, and their associated cost, can quickly explode. This is particularly true of metrics with “high cardinality” – basically datasets that can have a very large number of unique values.
High Cardinality Metric Example
Consider an example application service, where we measure application response time for each user_id, session_id and request_id – if each of these parameters can range from 0 to 1000, we have 1 billion unique potential combinations of these labels in our dataset. An example shell script that generates this high cardinality metric and sends it to a local statsd collector might look something like this:
#!/bin/bash
# StatsD Server Information
STATSD_HOST="127.0.0.1"
STATSD_PORT="8125"
# Configurable Variables
METRIC_NAME="myservice.responsetime" #Base metric name
METRIC_TYPE="ms"  #Metric type (timer)
INTERVAL=0.1  #Interval between sending data
MAX_COUNT=100000 #Number of metrics to send
# Function to send a metric to StatsD
send_metric() {
  local metric_name="$1"
  local value="$2"
  local tags="$3"
  echo "${metric_name}:${value}|${METRIC_TYPE}|#${tags}" | nc -u -w0 ${STATSD_HOST} ${STATSD_PORT}
}
# Generate and send metrics
count=0
while [ $count -lt $MAX_COUNT ]; do
  # Generate unique identifiers for high cardinality
  user_id=$((RANDOM % 1000))
  session_id=$((RANDOM % 1000))
  request_id=$((RANDOM % 1000))

  #generate response time from 100 to 200 ms
  metric_value=$(((RANDOM % 100)+100))
  # Construct metric with tags
  metric_tags="
user_id:${user_id},
session_id:${session_id},
request_id:${request_id}"

  # Send metric to StatsD
  send_metric "${METRIC_NAME}" "${metric_value}" "${metric_tags}"
  # Increment and sleep
  count=$((count + 1))
  sleep $INTERVAL
done
echo "Completed sending $MAX_COUNT metrics to StatsD."The problem is that every unique combination of labels is considered its own “custom metric” and billed as such by many observability vendors.
Enter the “OTel Processor”

Enter the Processor!
Now if you encountered the above scenario you might think, “well we shouldn’t really be sending that metric like that – we can ask the service team to change the code not to do that.” The problem here is that the service team typically has more important stuff to work on (opportunity cost), and well, maybe that metric is actually useful for measuring service health and diagnosing issues. We often see folks playing a constant game of “whack a mole” – reacting to high observability bills, going back to service teams to “whack” telemetry, some of which invariably would have been useful in the most recent incident etc… It’s sort of a case where observability cost is the “tail wagging the dog.”
Furthermore, don’t we want to encourage service teams to instrument more liberally, whether that be for metrics, logs or traces? You can’t manage what you don’t measure right?
So what if we let service teams instrument their code freely, and we could control the telemetry being sent at runtime? Turns out we can. One of the processors available for the OTel collector (and OTel collector contrib) is the “Filter Processor” – that allows you to specify policies to drop/filter various types of telemetry. This processor draws on “OTTL” or “OpenTelemetry Transformation Language,” providing a lot of flexibility in identifying the telemetry we want to filter. For example, in our scenario above – maybe we want to focus our custom metric on our top/paying customer tier – for example all user_ids that start with “1”. We can configure a processor in our collector like:
filter:
  error_mode: ignore
  metrics:
    datapoint:
- not ((IsMatch(attributes["user_id"], "^1")))This processor configuration tells the collector to drop all metric datapoints that have a user_id label (”attribute” in OTel speak) that does not being with “1” (our top/paying customer tier) – this has the net effect of dropping ~ 90% of metrics in our high cardinality script above (although we are still at ~ 100 Million label combinations 😃)
OTel Signal 2.: Logs
A recent conversation with a CTO yielded the quote “almost 100% of our logs go unread.” Sound familiar? It sure sounded like a processor could have been handy here as well! Many folks we talk to have at least a couple of tiers of logs they are interested in. One is typically a set of logs that are used for near term incidents, typically with retention on the order of weeks to keep costs down. Then there are the logs you need to keep around “just because” – for things like compliance and audit needs.
Set up an OTel Collector
With the OTel collector, this is relatively straightforward – we can create a logging configuration with two log pipelines (similar to the OTel collector overview pic above) – one to route filtered and deduped logs to our “near term” logging platform of choice, and one to route all raw (maybe redacted) logs to object storage or similar for compliance/audit and recall needs.
Processors can be placed in series within a pipeline, so for our near-term logging pipeline, we could have one processor to filter logs with severity lower than WARN (see here for the OTel logs data model and severity fields) and we could then leverage the “Log DeDuplication” processor to dedupe the remaining logs.
Our filter processor to drop all logs lower than WARN looks like this :
filter:
  logs:
    log_record:
- severity_number < SEVERITY_NUMBER_WARNand our deduplication processor might look like this in our OTel collector config:
logdedup:
  interval: 5s
  log_count_attribute: dedup_count
timezone: America/ChicagoOTel Signal 3.: Traces
Traces are probably the least adopted signal type among the current OTel signal types, but arguably the most powerful. We’ve seen some customers using traces be able to almost completely stop using logs in lieu of traces, and successfully use them to rapidly identify root cause of issues in their environments. Like metrics and logs before them though, traces (and their constituent spans) can generate vast volumes of telemetry in even a moderately sized Cloud Native environment.
Enter OTel Trace Sampling!
Up until fairly recently, the state of the art was to randomly sample some percentage of traces up front (see the OTel page here for more on sampling strategies) – for example let’s keep 0.1% or 1% of our traces at random. The problem with this is invariably, when something does go wrong, the odds are high that you’ve thrown away the interesting trace (the two most interesting aspects we hear about are traces with “high latency” or “errors”). It’s sort of like that scene in “Empire Strikes Back” where Han Solo is flying the Millennium Falcon through the asteroid field and telling C3PO “never tell me the odds!”

Finding that important trace – needle in a haystack?
Tail-Based Sampling in Telemetry
This has led to a concept called “Tail-Based Sampling”, where the entire trace can be assembled (e.g., in the OTel collector) and a decision made whether to retain it after the full trace has completed (e.g. keep this trace if it has latency > 300ms OR if it has errors) We’ve seen that the tail-based sampling capability alone can be justification for folks to start to instrument their traces with OTel. With tail-based sampling, yet again, there’s a processor for that. For example, to implement our tail-based sampling policy based on trace latency (e.g., greater than 300ms) or errors, we can create a processor in our OTel collector config as follows:
tail_sampling:
decision_wait: 10s
num_traces: 100
expected_new_traces_per_sec: 10
decision_cache:
sampled_cache_size: 100000
policies:
- name: test-policy-1
type: latency
latency:
threshold_ms: 300
- name: test-policy-2
type: status_code
status_code:
status_codes:
- ERROR
- UNSETWhile cost and value are two sides of the same coin, the clear driver for tail based sampling, like many of the policies (processors) above is one of value – it’s about increasing the signal, and reducing the noise – in this case so that our teams can more rapidly and effectively track down service affecting issues and improve MTTR.
Putting the OTel Pipeline
We can wire up our metrics pipeline, two logs pipelines and our traces pipeline into the following OTel collector configuration YAML – we have used “debug” exporters here but you could wire up your own observability backends, AWS S3 bucket etc… We have a statsd receiver for our metrics (can be used in conjunction with the high cardinality script above), and we assume a standard otlp receiver for our logs and traces. You’ll also note we’ve added a batchprocessor as the final processor in each of our pipelines as is best practice.
exporters:
debug:
processors:
batch:
filter/severity:
logs:
log_record:
- severity_number < SEVERITY_NUMBER_WARN
filter/userid:
error_mode: ignore
metrics:
datapoint:
- not ((IsMatch(attributes["user_id"], "^1")))
logdedup:
  interval: 5s
  log_count_attribute: dedup_count
  timezone: America/Chicago
tail_sampling:
  decision_wait: 10s
  num_traces: 100
  expected_new_traces_per_sec: 10
  decision_cache:
    sampled_cache_size: 100000
  policies:
    - name: test-policy-1
      type: latency
      latency:
        threshold_ms: 300
    - name: test-policy-2
      type: status_code
      status_code:
        status_codes:
          - ERROR
          - UNSET
receivers:
otlp:
protocols:
grpc:
endpoint: 0.0.0.0:4317
http:
endpoint: 0.0.0.0:4318
statsd:
endpoint: 0.0.0.0:8125
service:
pipelines:
logs/nearterm:
exporters:
- debug
processors:
- filter/severity
- logdedup
- batch
receivers:
- otlp
logs/objectstorage:
exporters:
- debug
processors:
- batch
receivers:
- otlp
metrics:
exporters:
- debug
processors:
- filter/userid
- batch
receivers:
- statsd
traces:
exporters:
- debug
processors:
- tail_sampling
- batch
receivers:
- otlpTo run the collector, we can use Docker (so you’ll need Docker installed). Looking at the docs, we can see that we can pass in a collector configuration file mounted as a volume, and assuming we save the above configuration as config.yaml – note we have also opened UDP port 8125 on the container assuming that the above metrics generation script is sending to the statsd receiver, and the general ports for OTLP. A neat (and easy) way to generate OTel logs and traces is to leverage something like https://github.com/krzko/oteldemo.
docker run -v $(pwd)/config.yaml:/etc/otelcol-contrib/config.yaml -p 8125:8125/udp -p 4317:4317 -p 4318:4318 otel/opentelemetry-collector-contrib:0.110.0
How can ControlTheory help you tame telemetry with the OTel Collector?
We assist teams in the use of OTel collector as an active telemetry control layer rather than a passive transport service.
- Gonzo supports direct inspection of OTLP log streams, which makes collector validation and pipeline debugging more immediate.
- Dstl8 extends that work by distilling telemetry into clearer evidence, impact, and operational context.
- This makes it easier to reduce noise without obscuring the signals that matter.
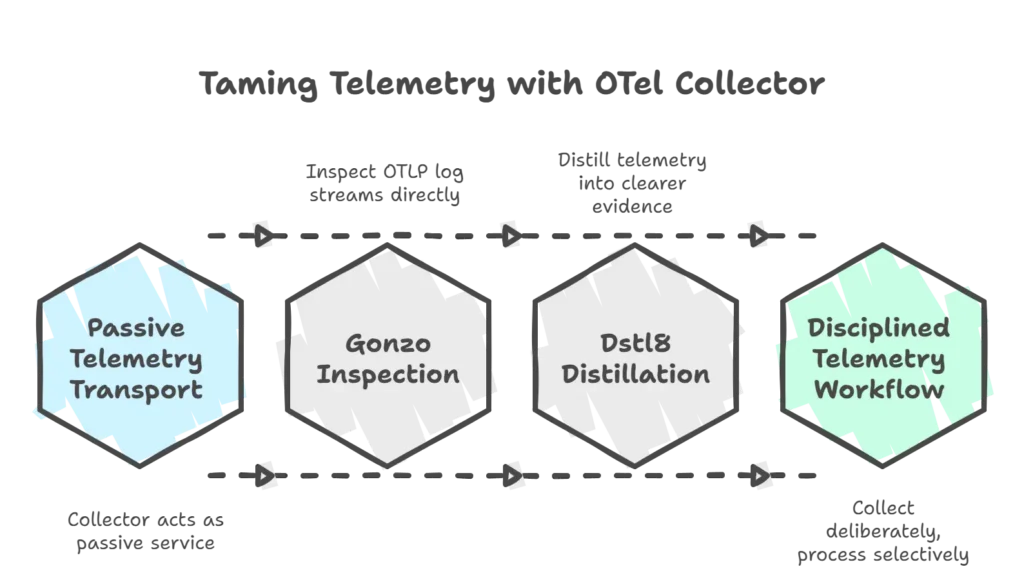
In practical terms, the result is a more disciplined telemetry workflow: collect deliberately, process selectively, and retain what improves reliability understanding.
Summary
In this blog, we’ve reviewed the OTel collector and how, with appropriate configurations, it can help to streamline our Telemetry for use cases across metrics, logs and traces. While exponentially growing telemetry volumes and associated costs grab the headlines, we’ve seen that effectively controlling our telemetry can significantly improve operational efficiency and improve signal to noise, by sending the right subsets of data to the right audiences/consumers, at the right time. If you’re interested in learning more about controlling your telemetry at scale, come say 👋 at KubeCon, and get a preview of what we’re building.
FAQs – Optimize Telemetry with OTel Collector
An OTel Collector is the operational layer that receives telemetry, applies processing rules, and then forwards that telemetry to one or more downstream systems. For most teams, it becomes the natural place to manage volume, structure, and routing, because it sits at the point where raw instrumentation becomes managed telemetry.
- An otel pipeline is built from otel receivers, otel processors, and exporters.
- Receivers ingest telemetry from applications, agents, or protocols such as OTLP or StatsD.
- Processors then modify, filter, batch, sample, or enrich the data.
- Exporters send the resulting telemetry to its destination.
- The order of the processors matters because each step changes what the next step receives.
- OTel receivers are the intake layer of the collector.
- They define how telemetry enters the otel collector.
- In practical deployments, the most common receiver types are otlp for OpenTelemetry-native traffic and protocol-specific receivers such as statsd where legacy or existing metric flows are still in use.
- The correct receiver choice shapes the rest of the otel collector architecture.
The otel collector filter processor is the mechanism used when teams want to keep telemetry flowing but exclude classes of data that add little value. Because it uses OTTL, the processor can express precise rules, such as removing datapoints outside a target customer tier or discarding low-severity log records in a production pipeline.
- The otel transform processor is useful when telemetry should be rewritten rather than simply dropped.
- It is appropriate for trimming fields, renaming attributes, standardizing structure, or preparing data for downstream analysis.
- It is especially relevant when teams need cleaner telemetry without changing the emitting application immediately.
In broader telemetry optimization practice, transformation often sits between filtering and export.
The otel collector can reduce cost by removing unnecessary metric datapoints before they reach a billing-sensitive backend:
- High-cardinality fields such as
user_id,session_id, andrequest_idoften create an excessive number of distinct metric series. - A processor rule can retain only the subset that has operational value, such as traffic from enterprise accounts or a defined customer tier.
- This allows teams to narrow telemetry volume without waiting for application instrumentation to be redesigned.
In practice, the collector becomes the point at which noisy metric production is converted into deliberate metric retention.
Yes. As can be seen in the article, a practical design pattern is when you use two log pipelines with different purposes.
The first handles filtered and deduplicated logs for short-horizon use, while the second routes broader log coverage to lower-cost retention. That division is important because it avoids forcing one storage policy to serve two fundamentally different needs.
Opentelemetry tail-based sampling is useful because it makes retention decisions with more context than simple up-front sampling. Instead of deciding at the start of a trace, the collector can wait and keep the traces that contain errors, unusual latency, or other conditions that matter during investigation. That makes the retained trace set more operationally valuable.
Yes. Gonzo fits naturally into an otel telemetry workflow because it can receive OTLP log traffic from a collector and display the resulting stream in real time. That makes it useful during local validation, pipeline debugging, and early-stage analysis, especially when an engineer wants to see the actual log stream rather than infer it indirectly from a downstream system.
Yes. Dstl8 can receive log telemetry from an OTel Collector pipeline, which means teams can apply collector-level filtering, transformation, and routing upstream while using Dstl8 to distill the resulting stream into actionable insight. This is especially useful when AI-generated code is producing unfamiliar runtime behavior at high volume – the collector manages the telemetry flow, and Dstl8 surfaces what matters within it.
Table of Contents
Logs. Understood. Instantly.
Analyze logs directly in your terminal with real-time insights and AI-powered pattern detection—no dashboards, no friction.
 Back
Backpress@controltheory.com