


Here’s a question I’ve been asking a lot lately: if your AI SRE finds the problem, diagnoses it, and fixes it, all on telemetry it brings itself, what is your observability platform for?
For most teams, the honest answer is: less than they’re paying for. That question is the reason for Dstl8 2.0, which we launched this week at KubeCon + CloudNativeCon North America in Salt Lake City.
Two problems nobody fixed
For years, teams have bought observability the way they buy insurance: because going without feels risky, and because it’s what has always been done. They pay to ingest, index, and retain every byte, then sample and drop data to keep the bill in check. Most of that data is never looked at again. Companies are paying real-time prices for an archive. We call that the Telemetry Tax.
AI SREs promised to change the equation. But most of them were built on top of that same platform. They investigate what it flags, and they reason over whatever survived the cost cuts. If nothing fires, they never look. That’s the Telemetry Trust problem: an AI SRE is only as good as the telemetry it’s handed, and most are handed the leftovers.
The stakes keep going up. Two-thirds of organizations hosting generative AI models now run some or all of that inference on Kubernetes, according to the CNCF Annual Cloud Native Survey. The same platform now carries services, agents, model servers, and GPUs, and teams ship changes to all of it faster than ever. One bad deploy can ripple through every layer at once. A bigger blast radius needs a wider net, not a thinner one.
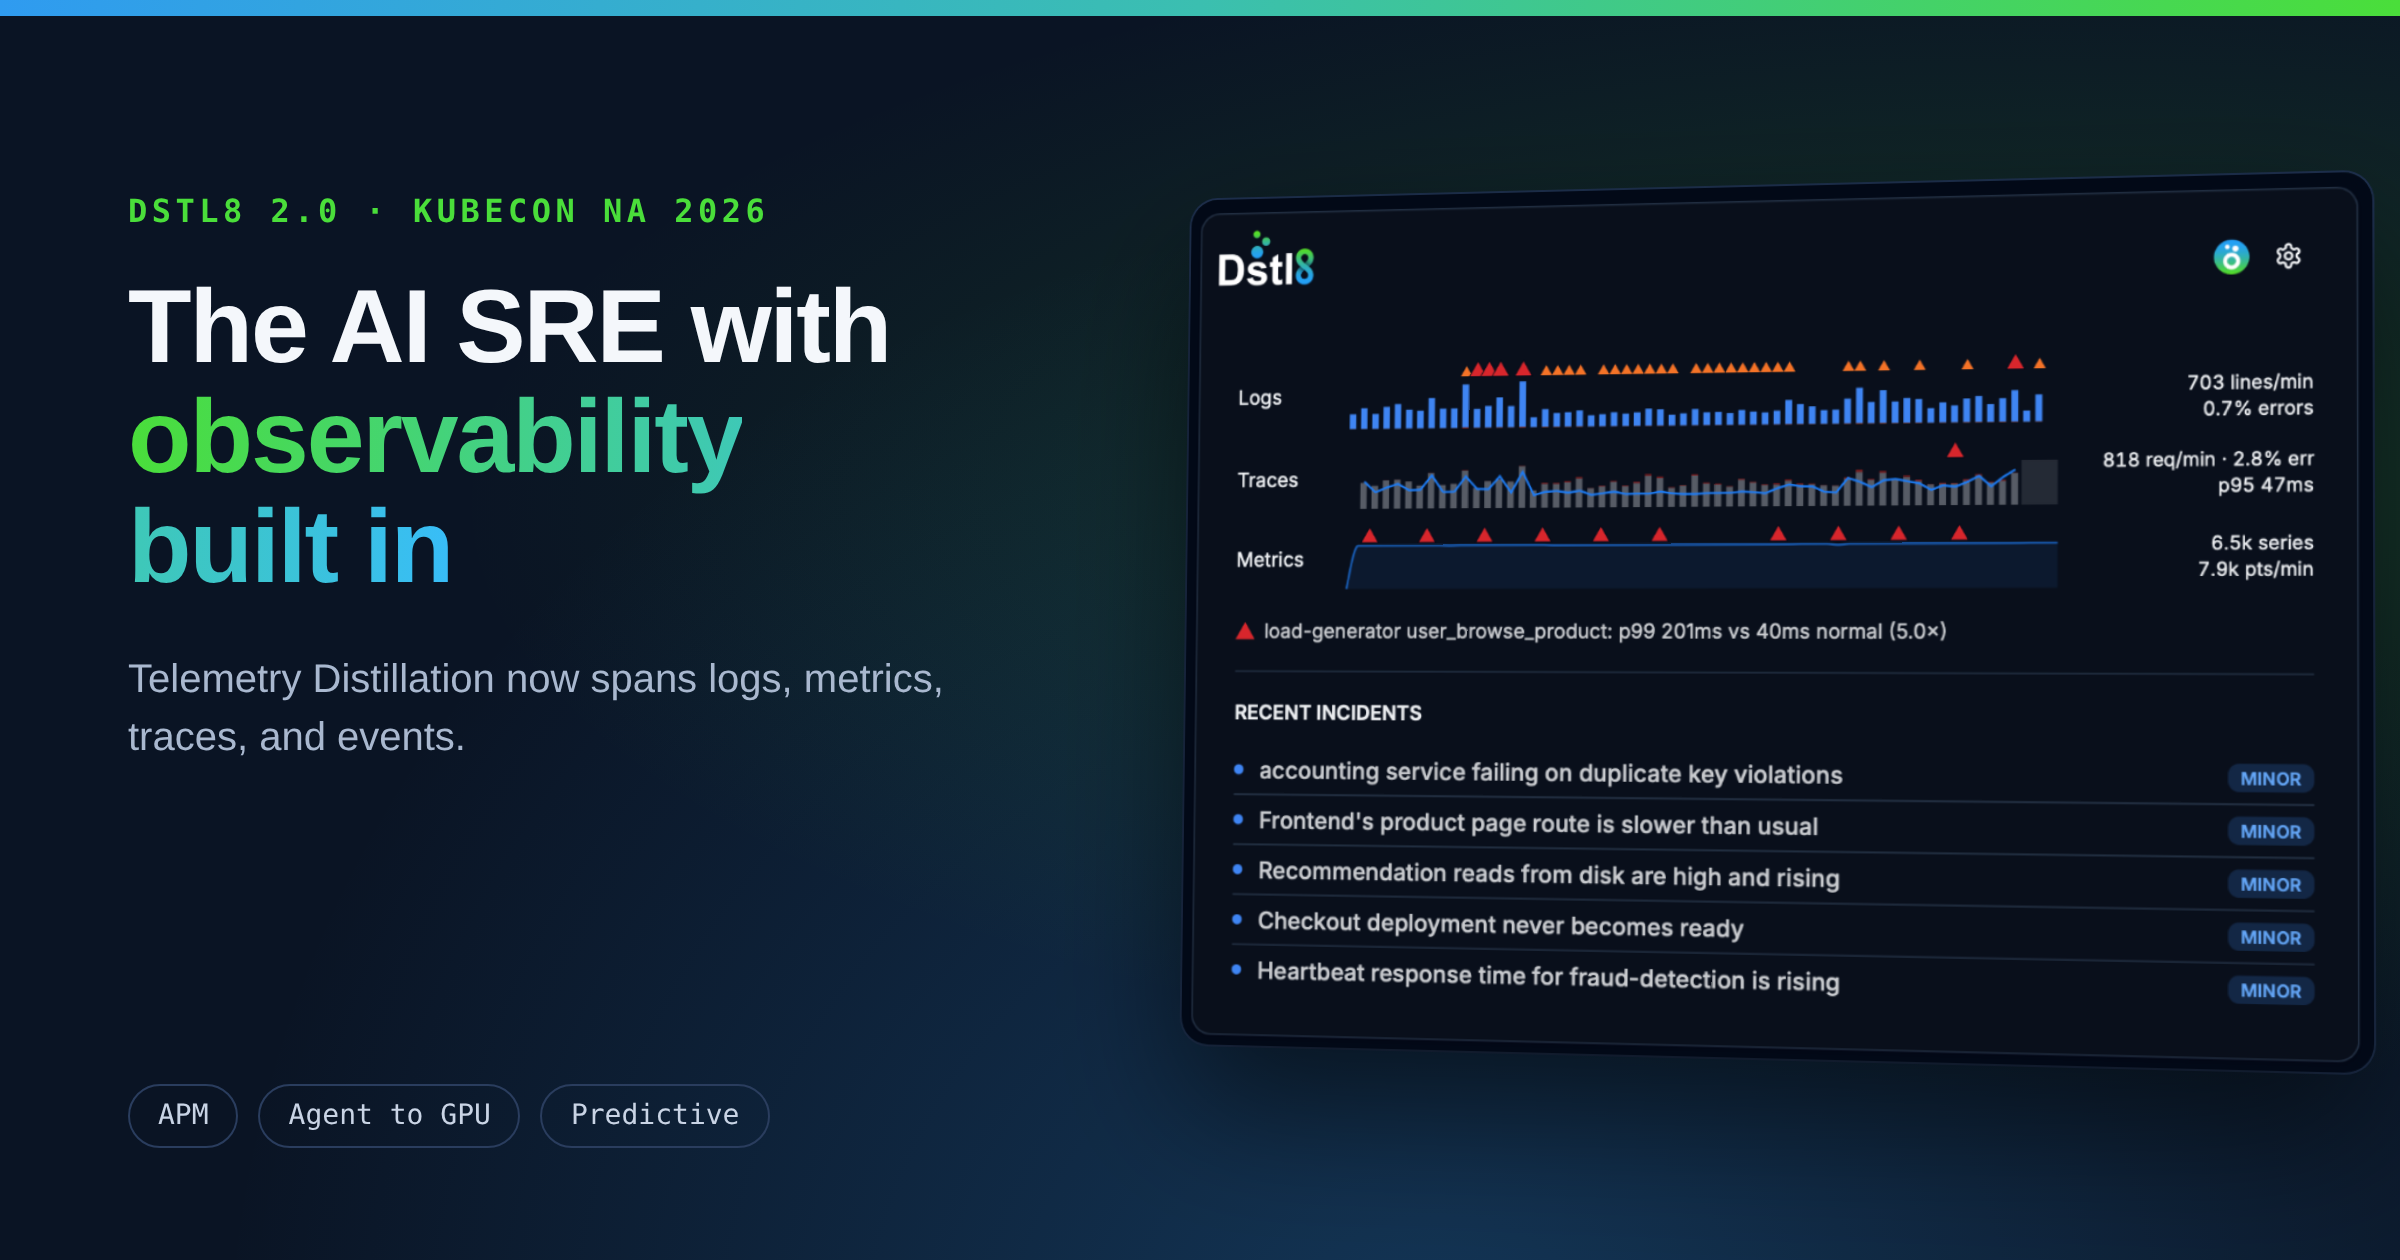
That’s why we built Dstl8 as the telemetry-native AI SRE. With 2.0, Telemetry Distillation now spans logs, metrics, traces, and events, so Dstl8 works from telemetry it distills itself rather than data borrowed from an observability platform. That lets it take on APM, follow AI workloads from agent to GPU, and predict problems before they hit.
Everyone else added an AI SRE to observability. We built observability into the AI SRE.
What’s new: Telemetry Distillation across every signal
Most telemetry gets stored before anyone looks at it. Telemetry Distillation flips that order. Every log, metric, and trace is analyzed first, as close to the source as possible, and what Dstl8 keeps is chosen based on what it found. It isn’t sampling or filtering: Dstl8 reads everything, keeps the facts, and saves the examples that matter.
Until now, that applied to logs. Dstl8 2.0 extends it to metrics and traces, both in preview, and reads them together with Kubernetes events. Across all of it, Dstl8 reasons over four things: sentiment, patterns, anomalies, and severity. Sentiment is the one most people haven’t seen before. It’s what your systems are telling you about themselves, and it catches the slow, quiet degradations that never trip a threshold.
The result is one place where logs, traces, and metrics are distilled side by side, and where incidents show up already named in plain English, with no alert rules written to find them.
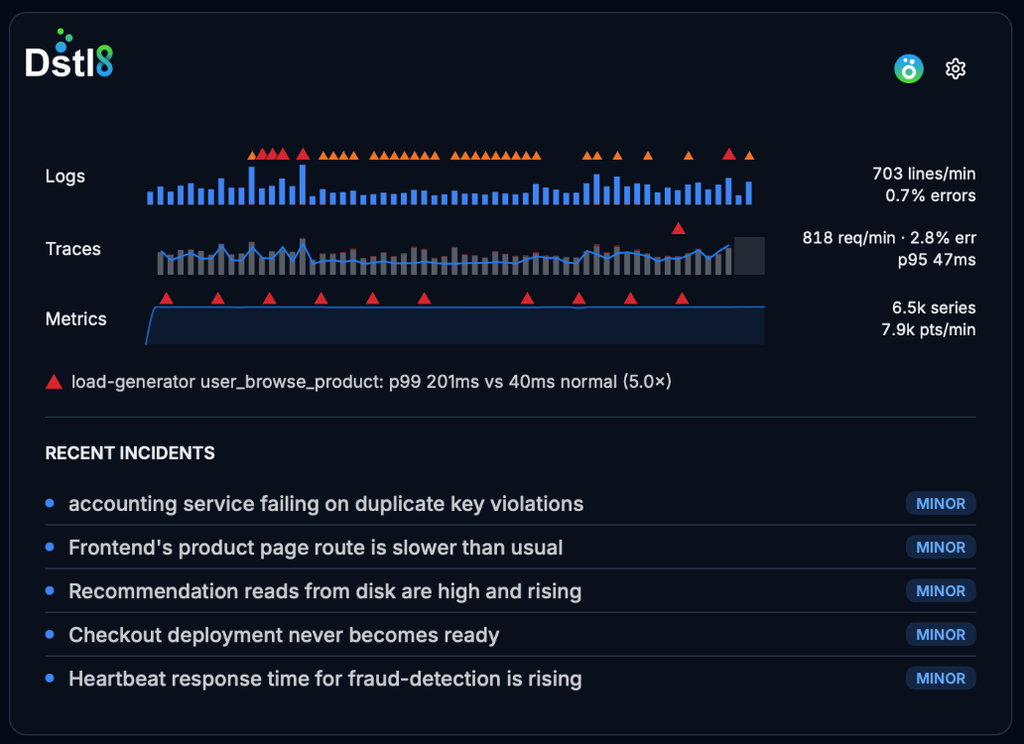
Dstl8’s home view: logs, traces, and metrics distilled together, with recent incidents found and described in plain English.
What that unlocks
With every signal distilled in one place, Dstl8 can take on problems that used to need several tools.
APM, without a separate APM tool
Traces let Dstl8 find application performance problems on its own: slow endpoints, rising error rates, new request paths. It picks out the worst request paths without being told where to look, then ties each one to the logs, metrics, and deploy behind it, down to the line of code.
Open a trace and you see each span measured against its usual p50, so the slow hop jumps out. The log lines that service wrote during that span sit right beside it. No switching tabs, no copying trace IDs between tools.
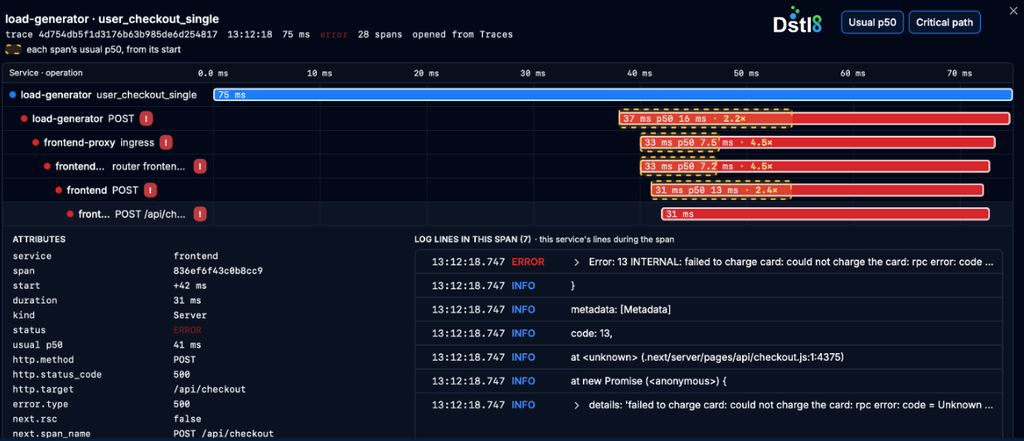
A failed checkout: every span compared to its normal latency, with the service’s own log lines (“failed to charge card”) alongside the span that threw them.
AI workloads, from agent to GPU
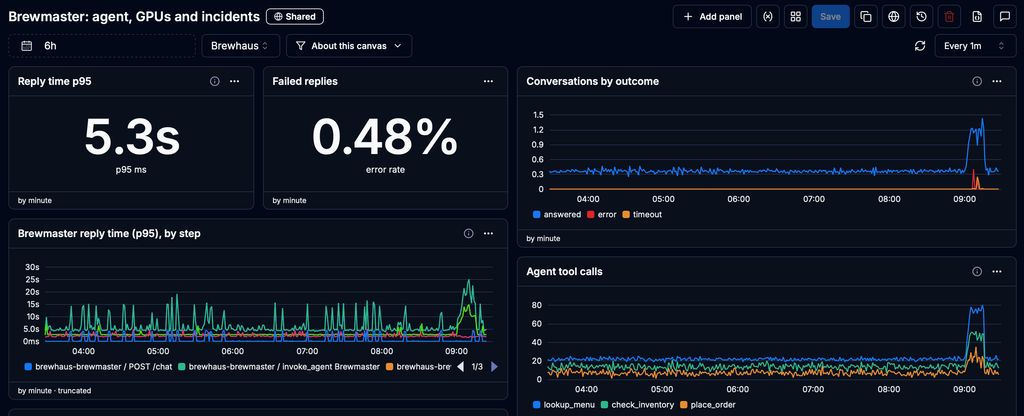
Dstl8 follows AI workloads the whole way down: from the agent, through each LLM call, to the model server (vLLM) and the NVIDIA or AMD GPU doing the work. LLM calls are traced with the OpenTelemetry GenAI conventions, and prompts and replies stay out. GPU metrics come from the exporters teams already run.
What comes back is a plain-English readout, for example: “gpu-instance-0 holds 29.3 GiB, 66% of its memory, but was busy only 1% of the time. Something has it reserved without using it.” For GPU and AI cloud providers and their customers, that means a faster answer to the question asked most, “is it your infrastructure or my code?”, with the evidence to settle it.
Predictive detection
Metrics come with forecasts: when a disk will fill, when a CPU will hit its limit, when GPUs will max out. “Your disk is full” means you’re already in trouble. “Your disk will be full at 11 p.m.” gives you time to fix it.
From signal to fix
Every incident is explained by what changed and when, with evidence from every signal, not just the one a single tool happens to hold. Whether the cause is infrastructure, configuration, or application code, Dstl8 pinpoints it and delivers a suggested fix with the evidence behind it, in Slack or straight into Claude Code, Cursor, or Codex.
It remembers, and it shows its work
An AI SRE that forgets every incident the moment it closes will keep solving the same problems. Möbius, Dstl8’s AI agent, learns from how your incidents are resolved: which errors are known issues, which are just noise, what depends on what, and the guidance your team gives it.
None of it is a black box. Everything Möbius learns shows up as a fact you can review. Approve what’s right, edit what’s close, retire what’s wrong, or add guidance of your own. The dependency map shows what it has learned about how your components connect, and every fact links back to the incidents it came from.
That’s what lets teams trust the answers, and it’s why the same incident shouldn’t need solving twice.
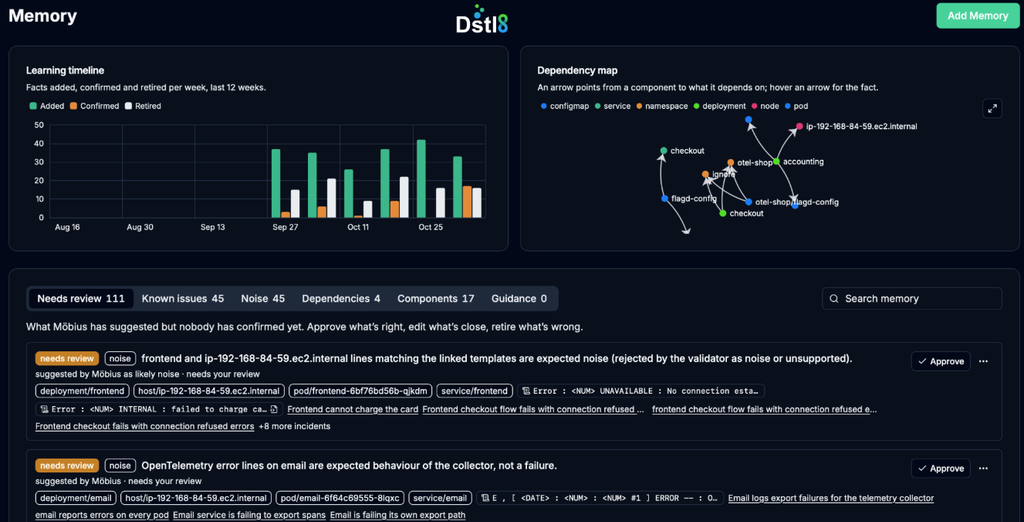
Möbius memory: what Dstl8 has learned about a workspace, with each fact open for the team to approve, edit, or retire.
Works with what you already have
You don’t have to rip anything out to try this. Prometheus- and Jaeger-compatible endpoints let Grafana and Jaeger read Dstl8 metrics and traces, so teams can keep familiar dashboards while Dstl8 does the work. And with Dynamic Canvas, you can create dashboards on demand, or let Möbius build them around each diagnosis, so engineers see the evidence instead of maintaining static dashboards nobody reads.
Getting started is one command. dstl8 setup connects Kubernetes, AWS, and OpenTelemetry sources in minutes, with no integration project. There’s no ingest meter and no investigation meter.
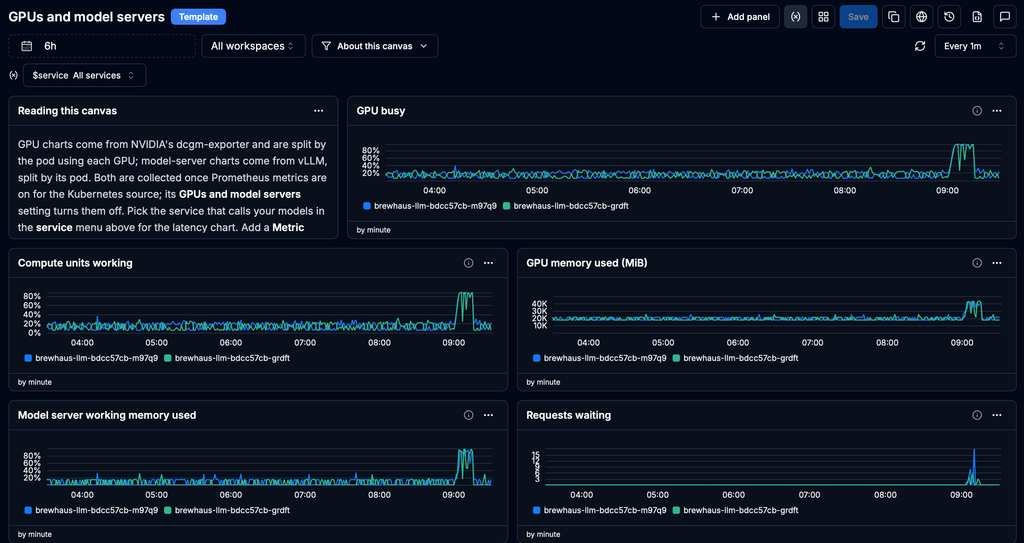
A ready-made canvas for GPUs and model servers: NVIDIA dcgm-exporter and vLLM metrics, split by pod, ready to drop into any workspace.
Already in production
This isn’t a demo-only idea. At an enterprise fintech, Dstl8 resolved 328 incidents across 13 Kubernetes clusters in its first two months, without the team writing a single alert rule.
See it this week
Dstl8 2.0 is available today, with metrics and traces in preview. If you’re at KubeCon, come find us at booth 188 (Hall 1, Solutions Showcase, Salt Palace) through Thursday. We’ll show you the whole path, from signal to fix, on live systems.
Not in Salt Lake City? Start a 14-day free trial at dstl8.ai, and ask your AI SRE what your observability platform is for.
Table of Contents
Telemetry-Native AI SRE
Dstl8 distills runtime signal at the source, routes the answer back to the agent or engineer to fix the problem.
 Back
press@controltheory.com