


Dstl8 · Free 14-Day Trial
Find what broke.
Across every deployment.
Dstl8 streams logs from Vercel, Supabase, Kubernetes, and 50+ sources, then uses Möbius AI to tell you what failed, why, and where — with evidence from your actual logs. Built for teams shipping AI-native code.
brew install control-theory/dstl8/dstl8
The gap
01
Unknown unknowns
Dashboards catch failures you’ve already seen. AI-generated code breaks in ways nobody wrote an alert for — novel service interactions, unexpected dependencies, agent loops that drift without throwing. Your alerts stay silent while production degrades.
02
10× the logs, same two eyes
Claude Code, Cursor, and Copilot ship 10× faster — and generate 10× more log volume. Pipelines fragment across Vercel, Supabase, Kubernetes, OTel. Finding the one line that explains the failure means correlating six dashboards by hand at 2am.
03
Reactive, not proactive
Your observability tells you something broke. It can’t tell you what, why, or where to look first. By the time the page fires, customers have already noticed. Debugging is 90% finding, 10% fixing — and finding is where you lose the night.
Interactive demo · no signup
Click through it yourself.
Watch Dstl8 detect a runtime issue and fix the code — no account required.
How Dstl8 works
Stream. Ask. Distill.
Dstl8 finds what broke before your customers do. Powered by Möbius AI, our three-layer architecture distills telemetry, identifies patterns, and answers “what’s wrong and why” in real time.
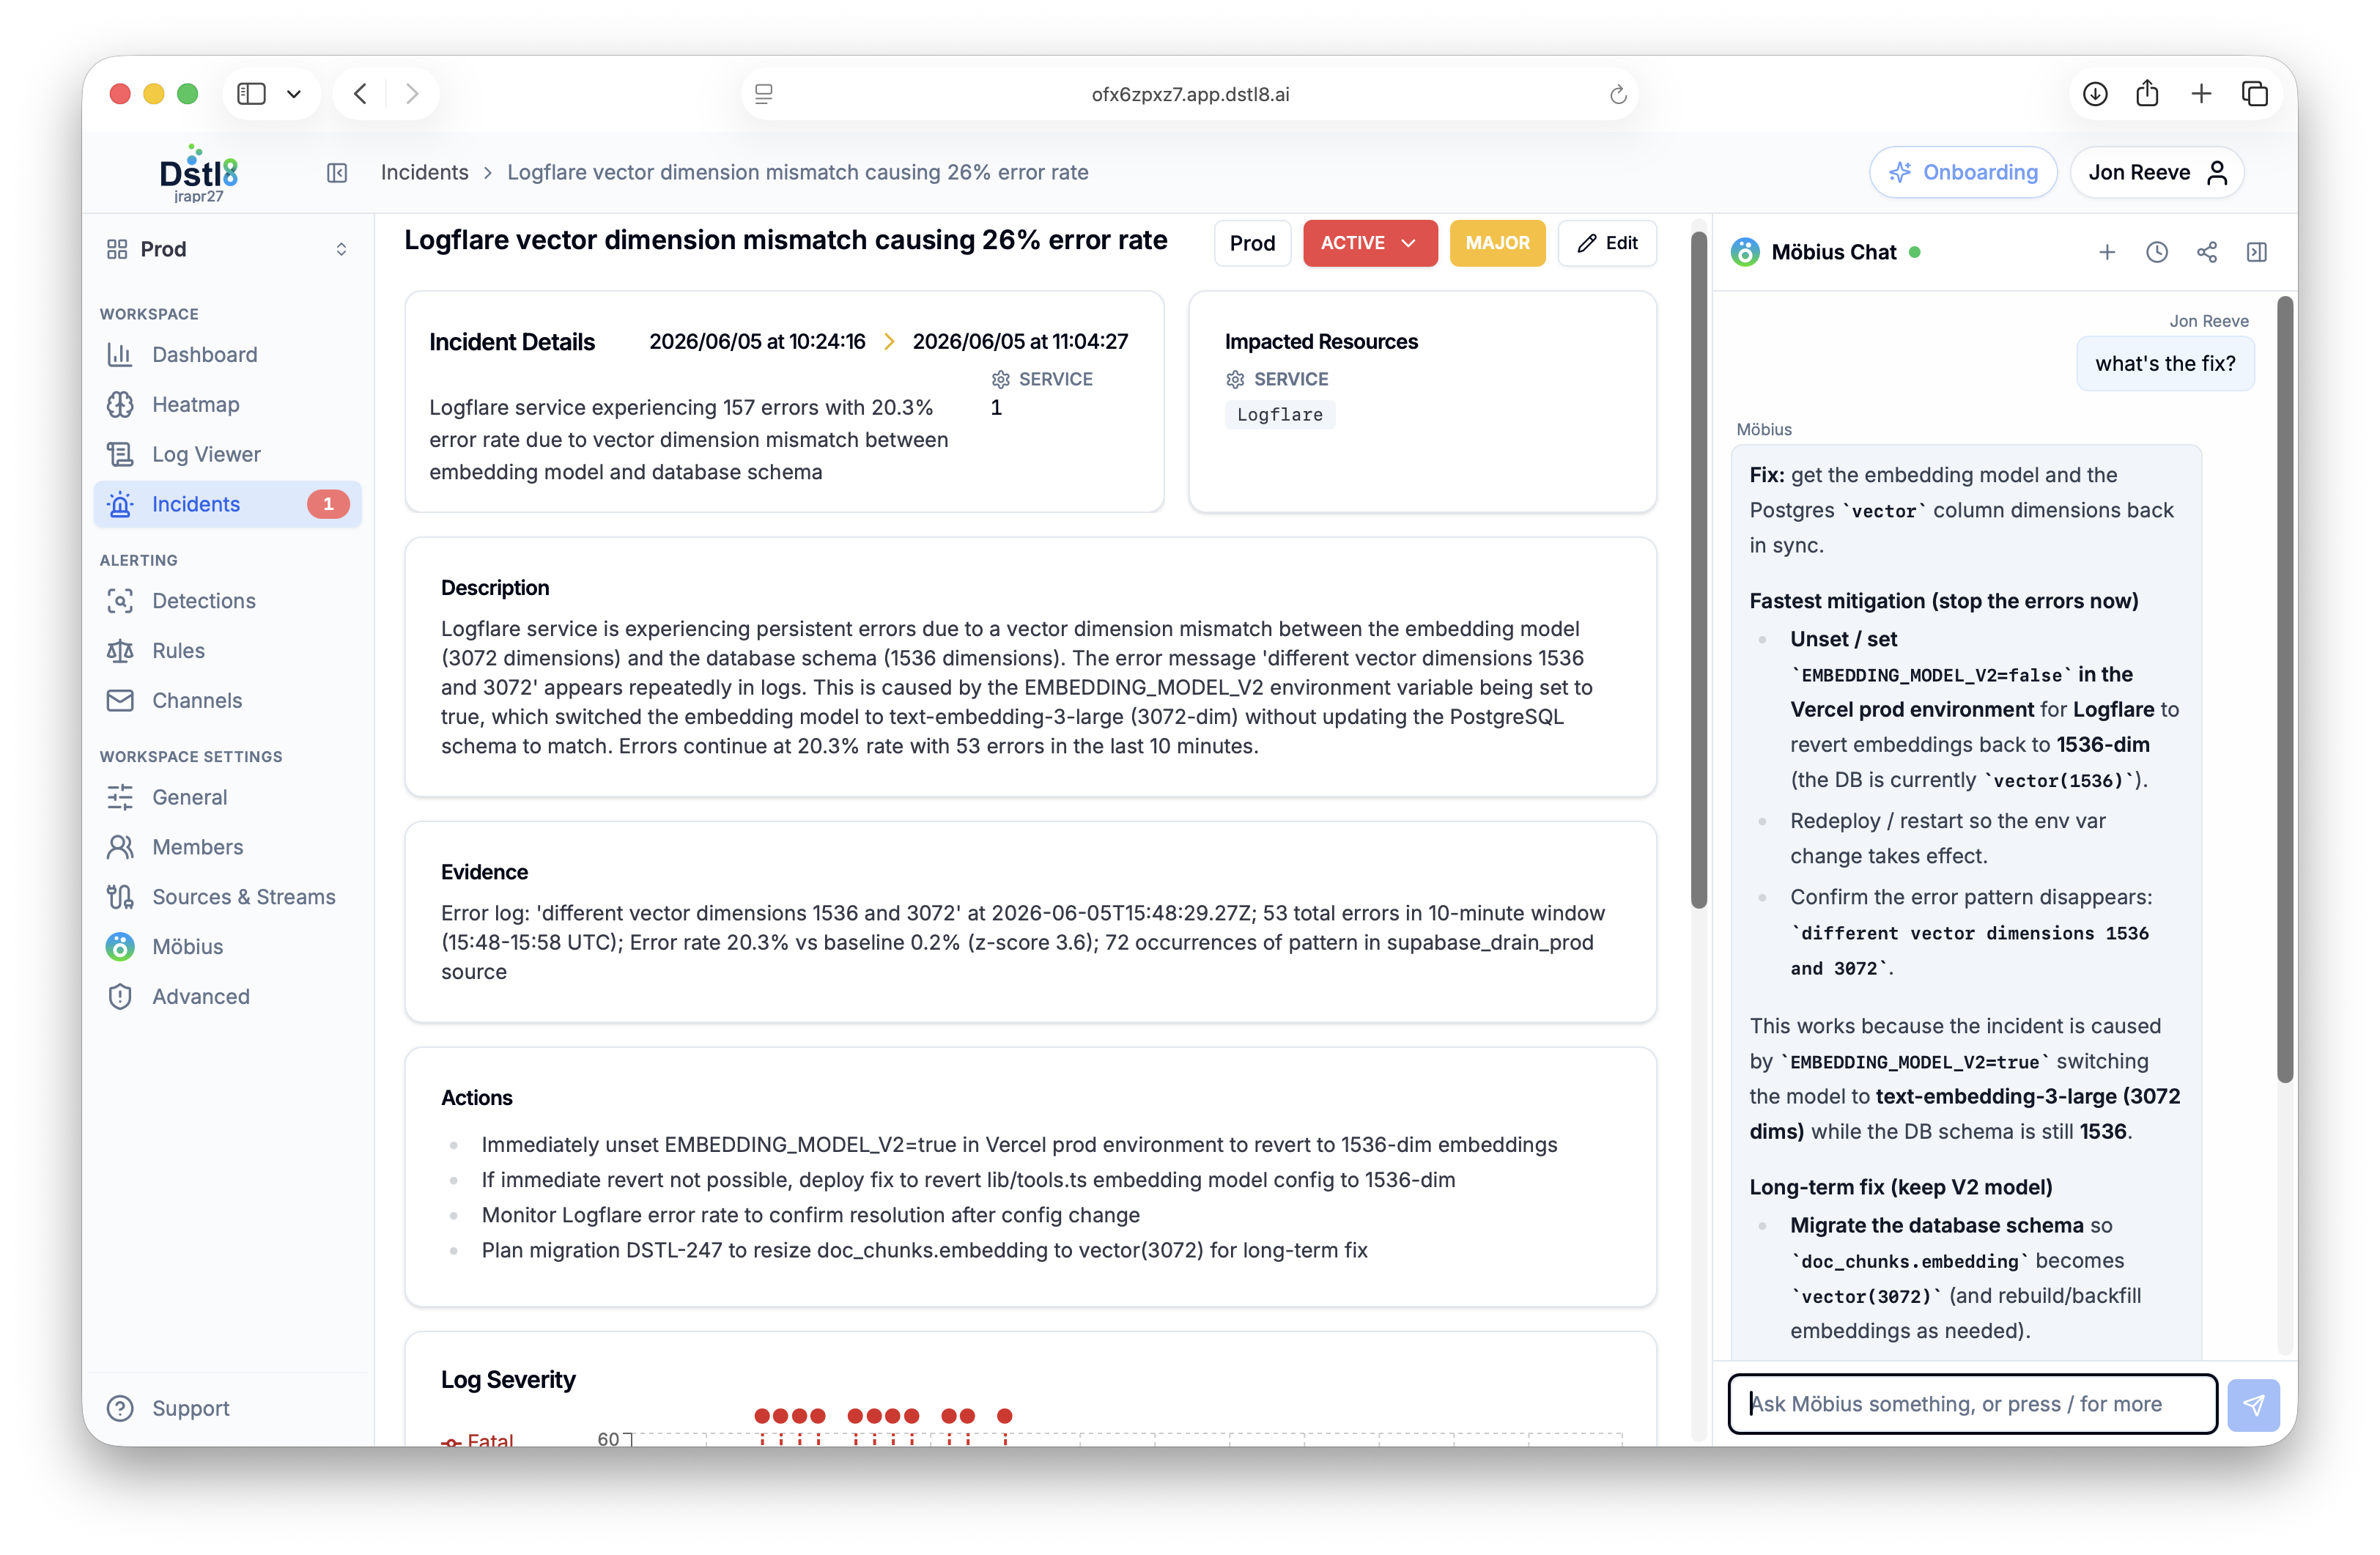
Unknown unknowns
Dashboards catch failures you’ve already seen. AI-generated code breaks in ways nobody wrote an alert for — novel service interactions, unexpected dependencies, agent loops that drift without throwing. Your alerts stay silent while production degrades.
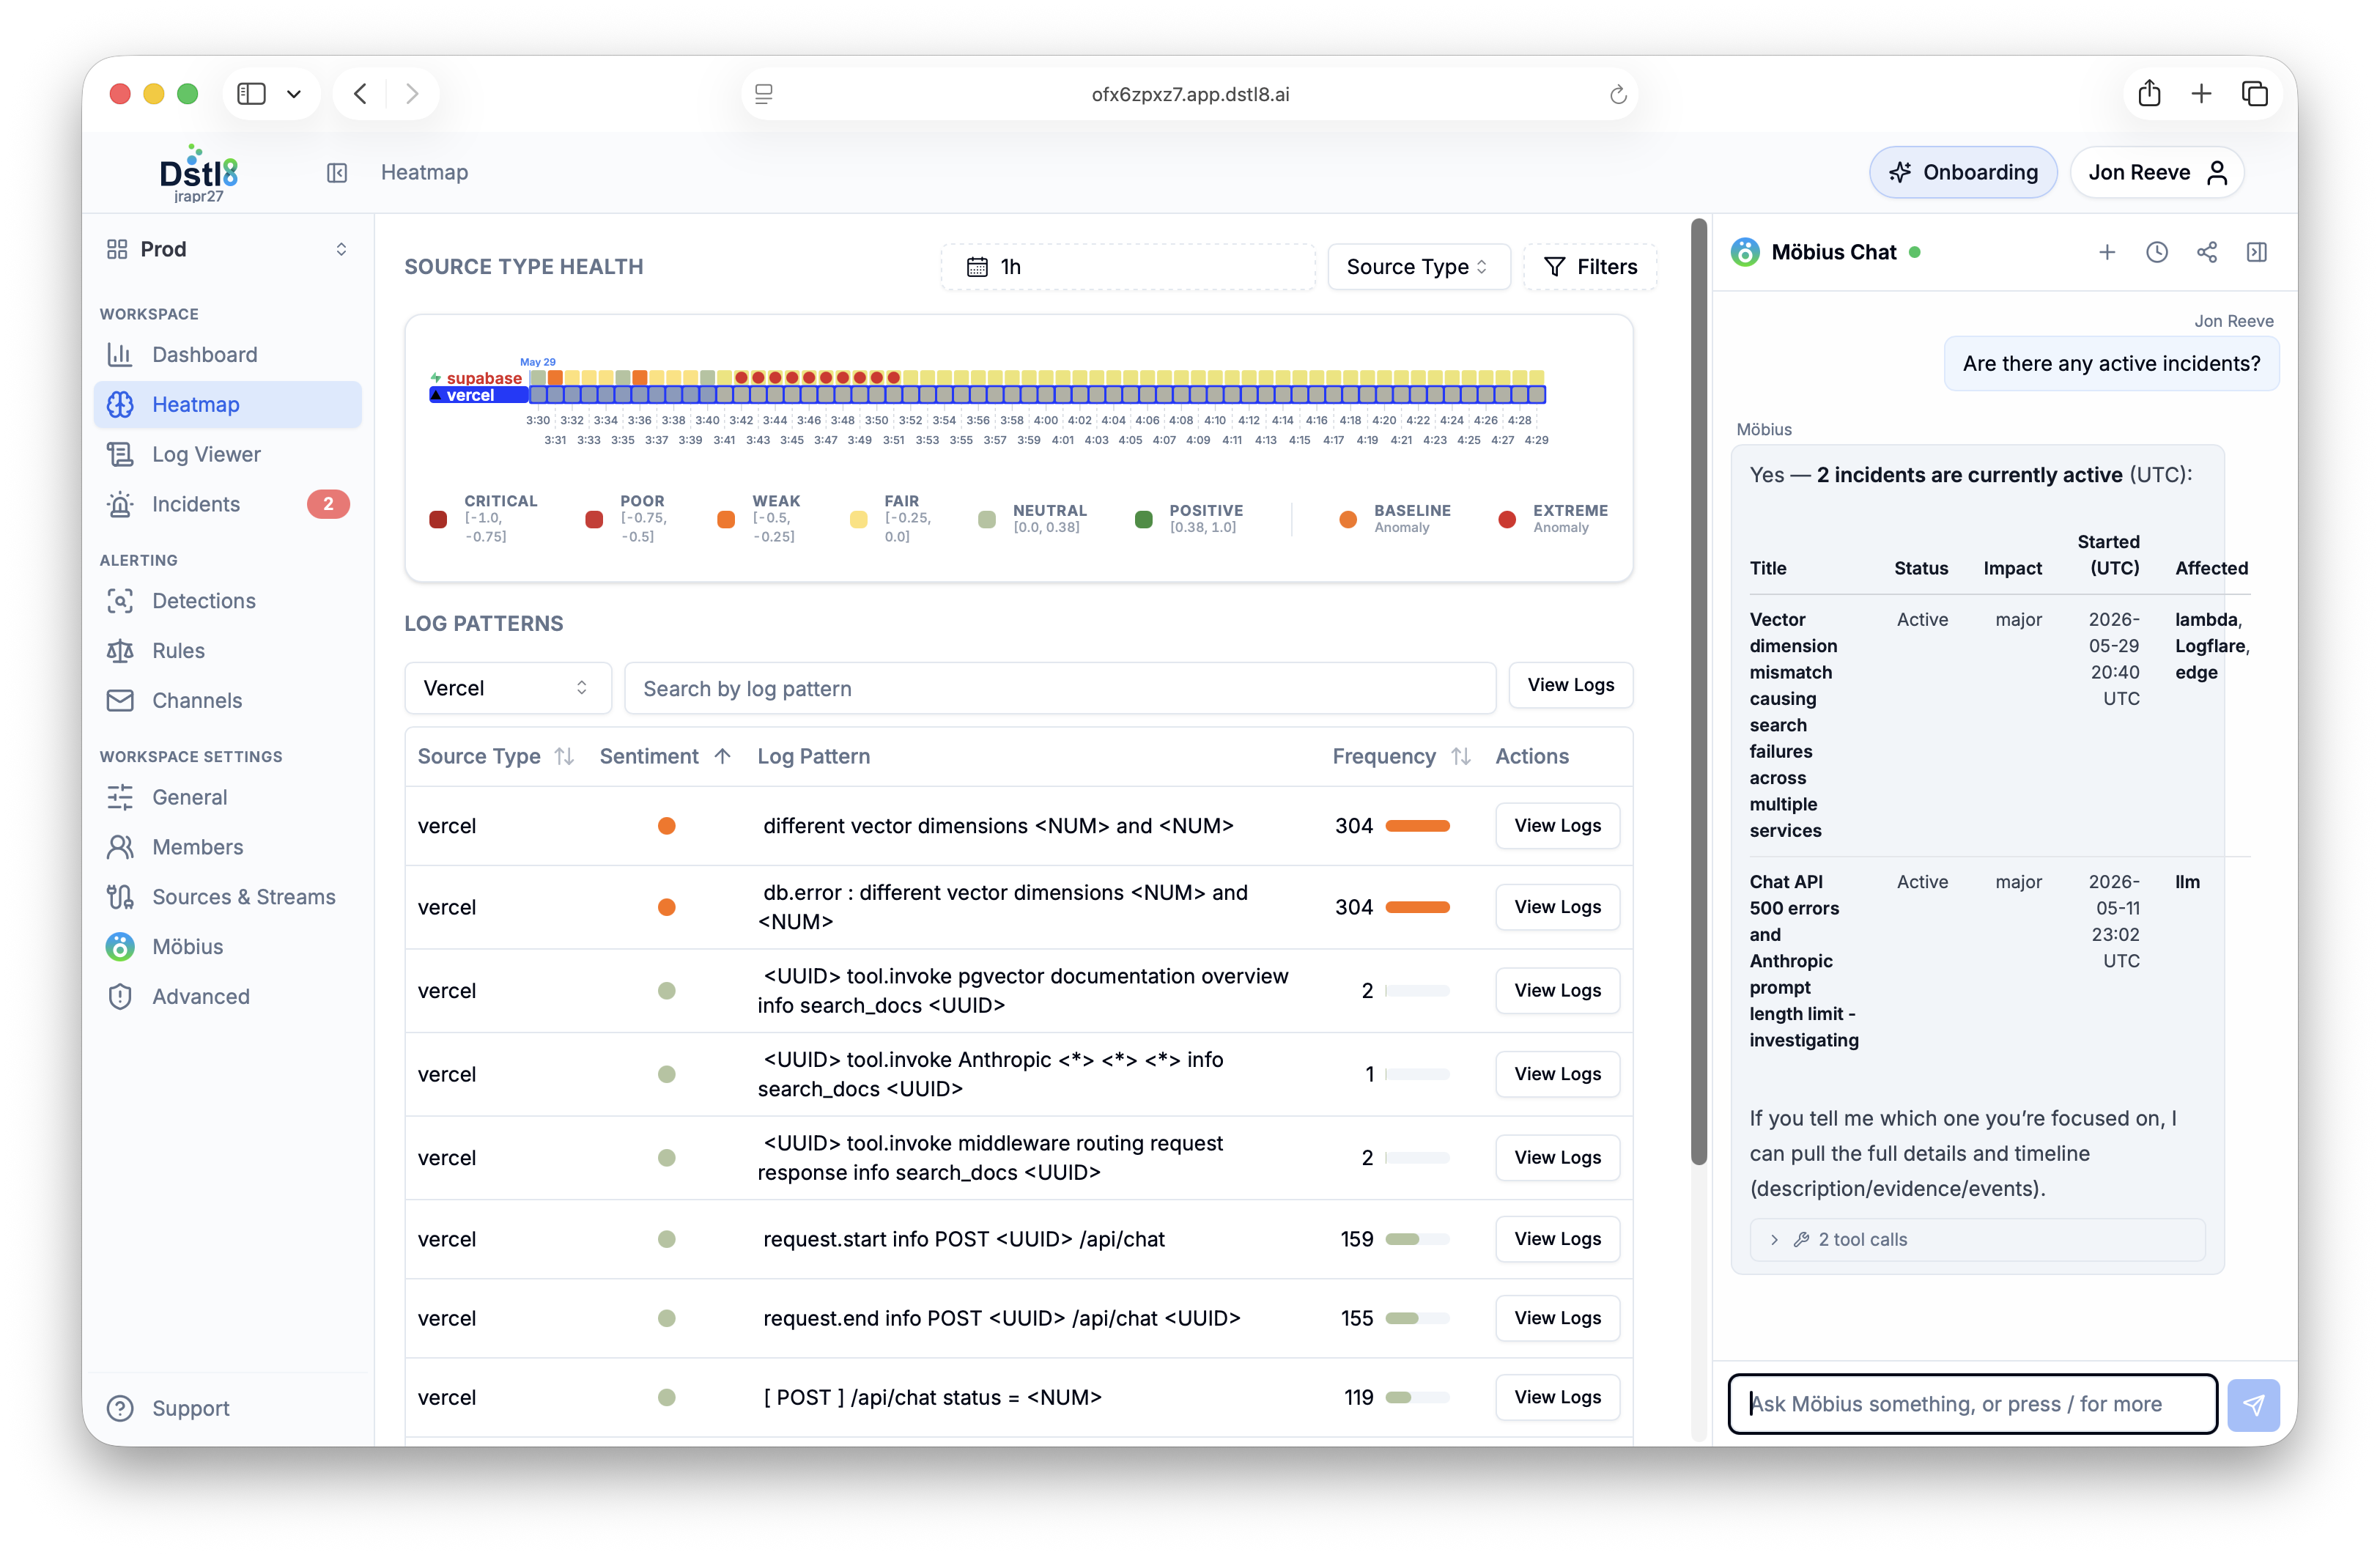
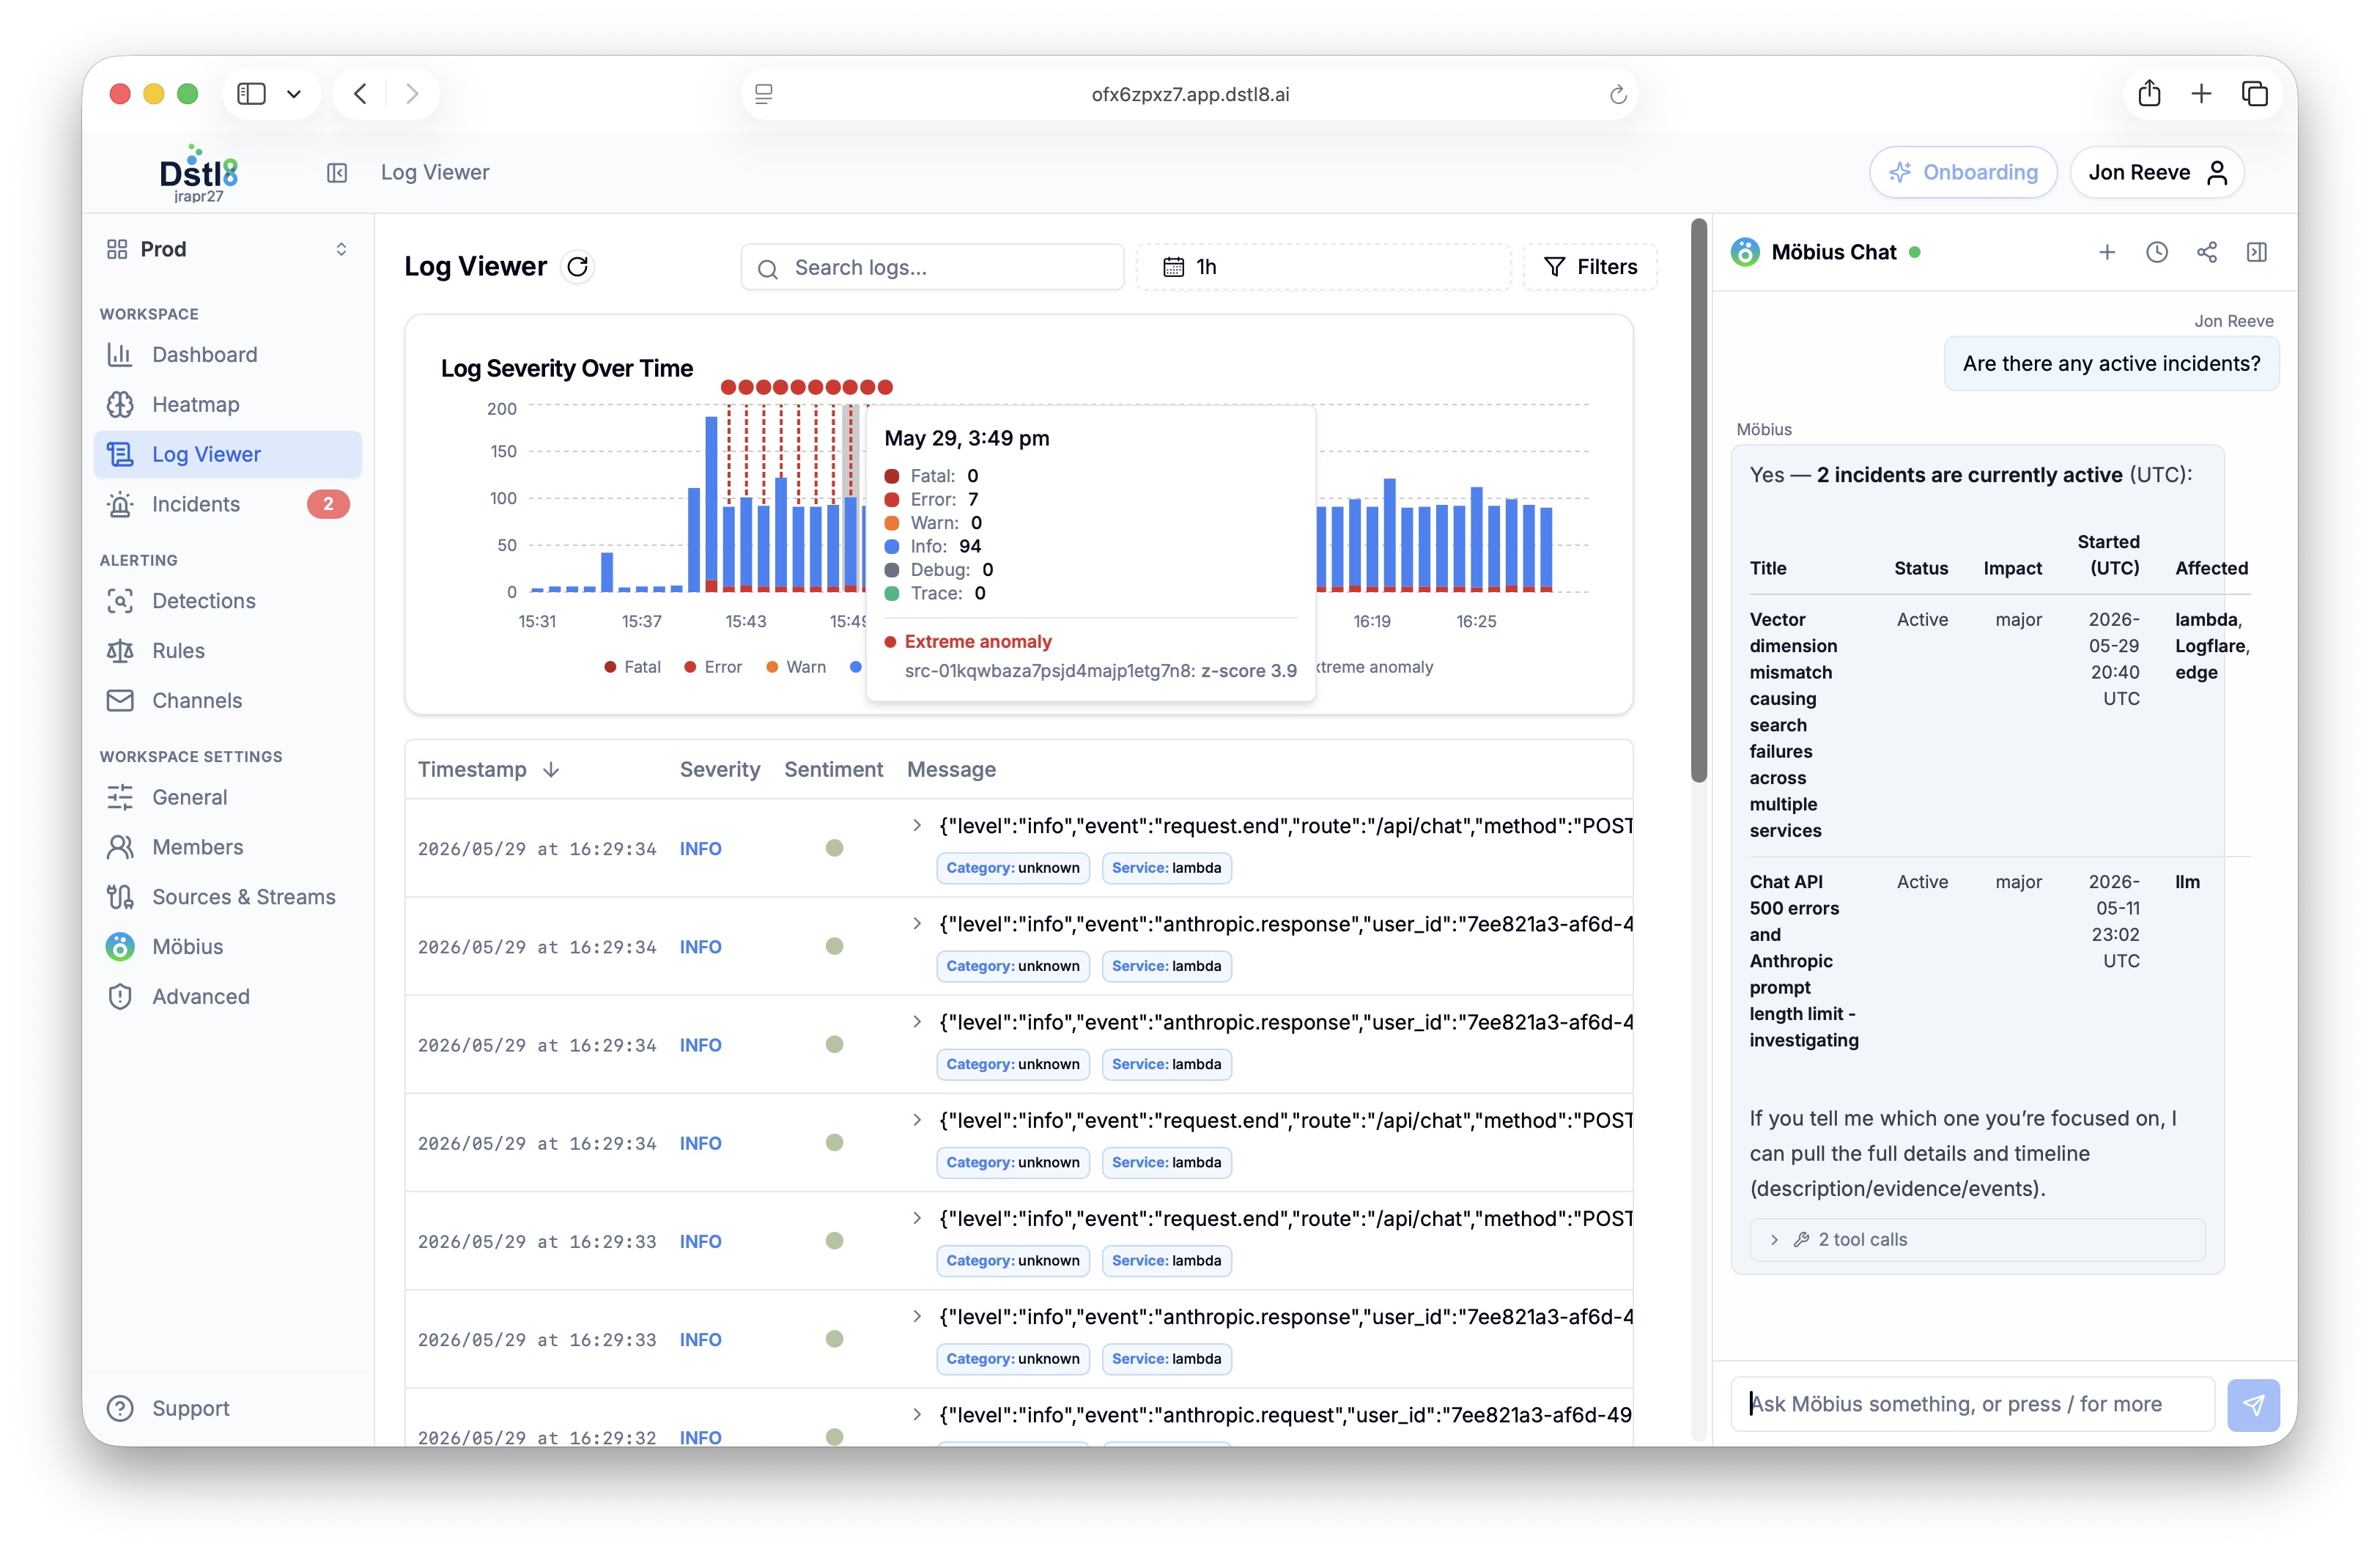
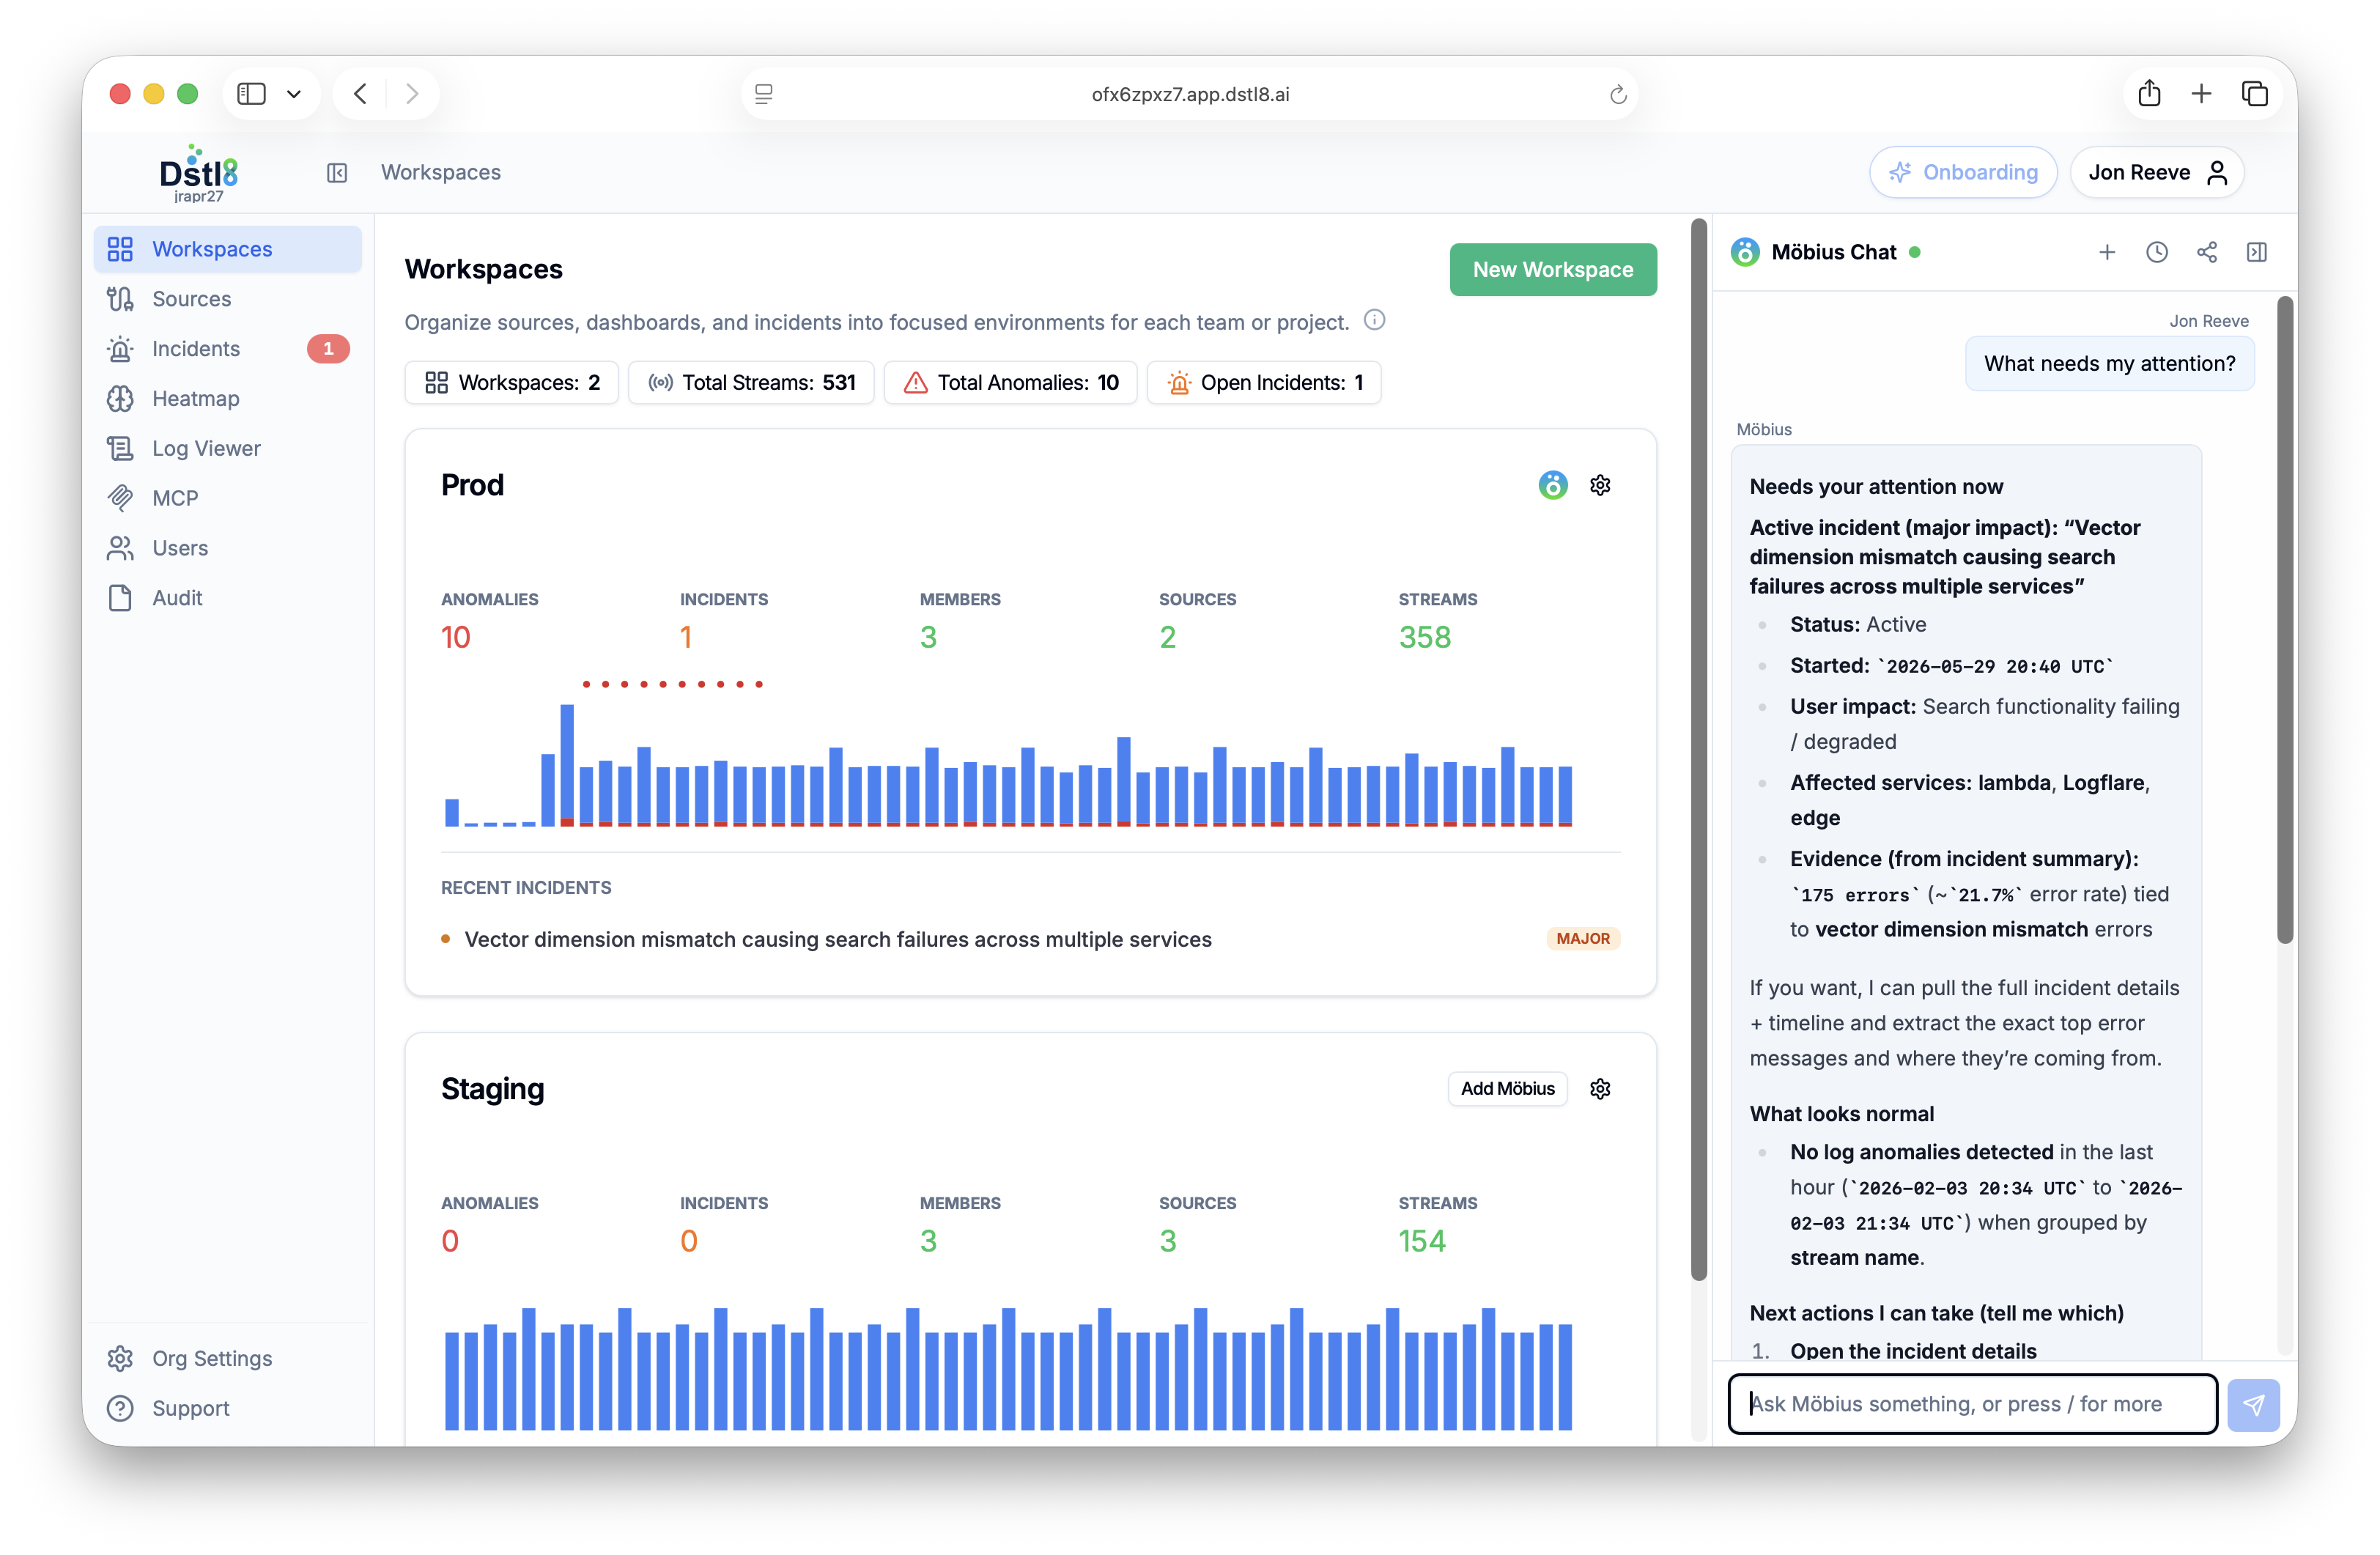
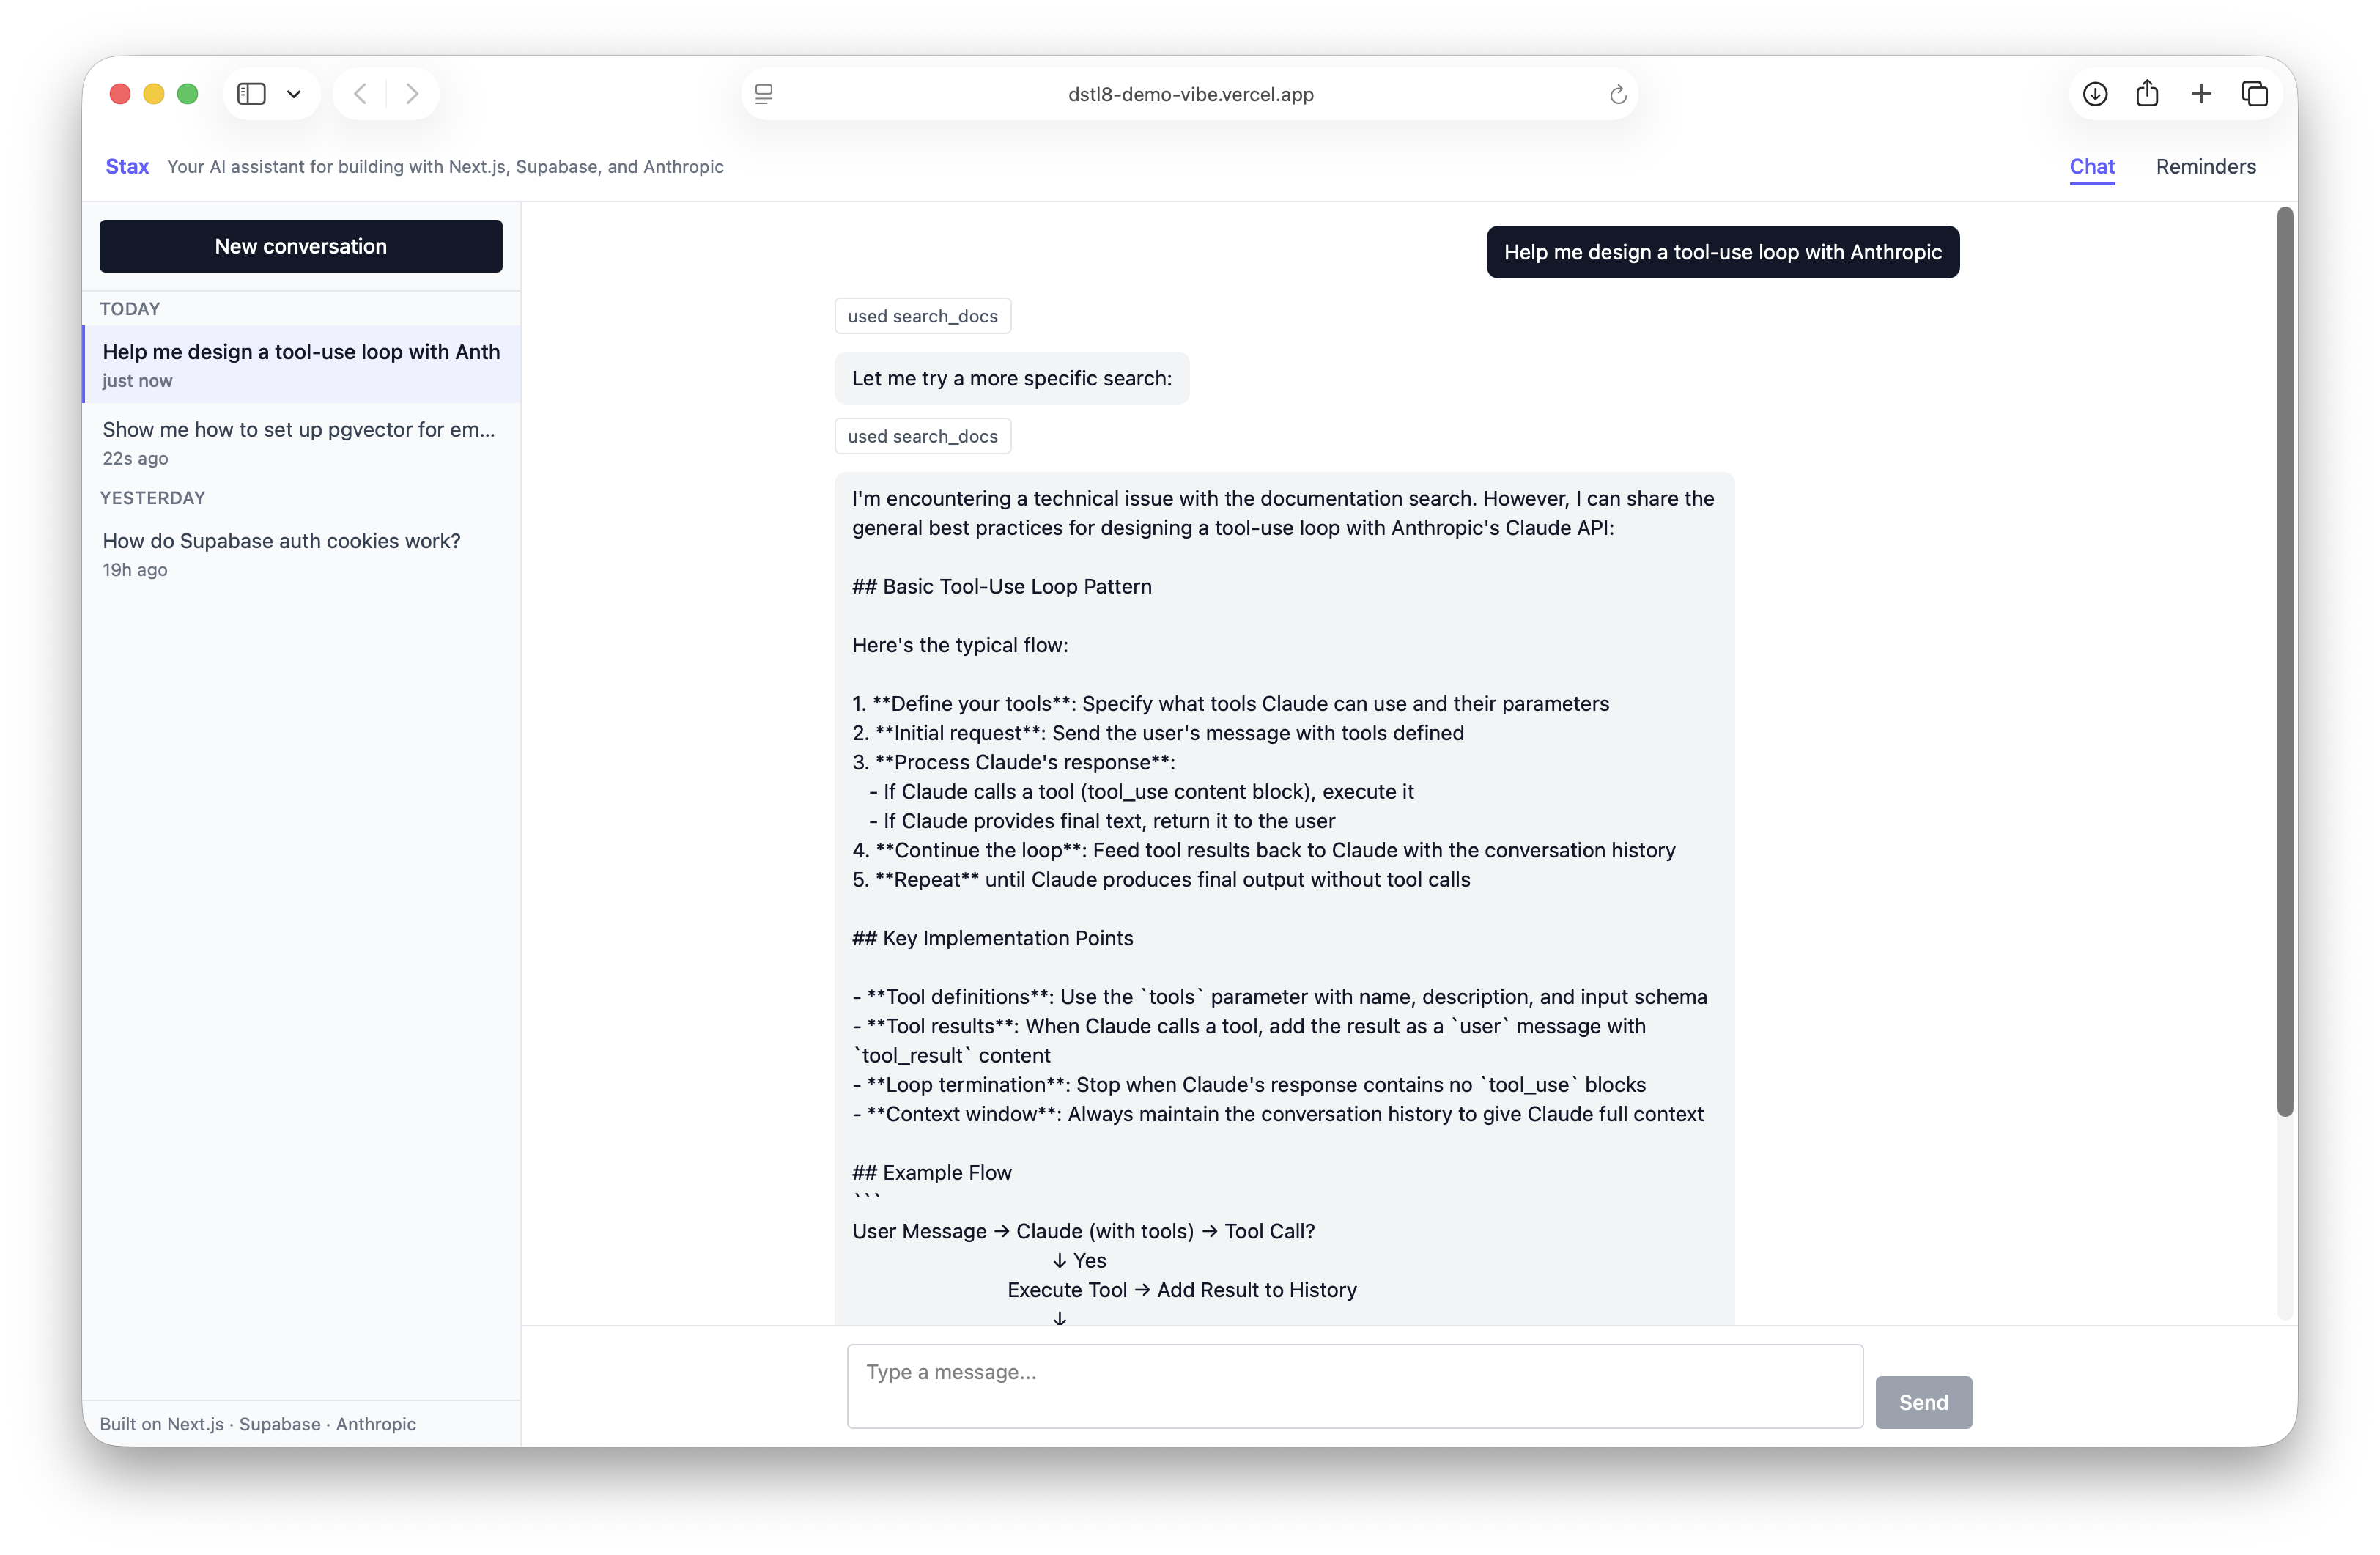
Ask
Möbius AI chat: type “what broke in the last deploy?” and the answer surfaces with cited log lines — not a dashboard to investigate.
Distill
OTel pipeline view showing ingest volume before and after, with the cost-savings metric front and center.
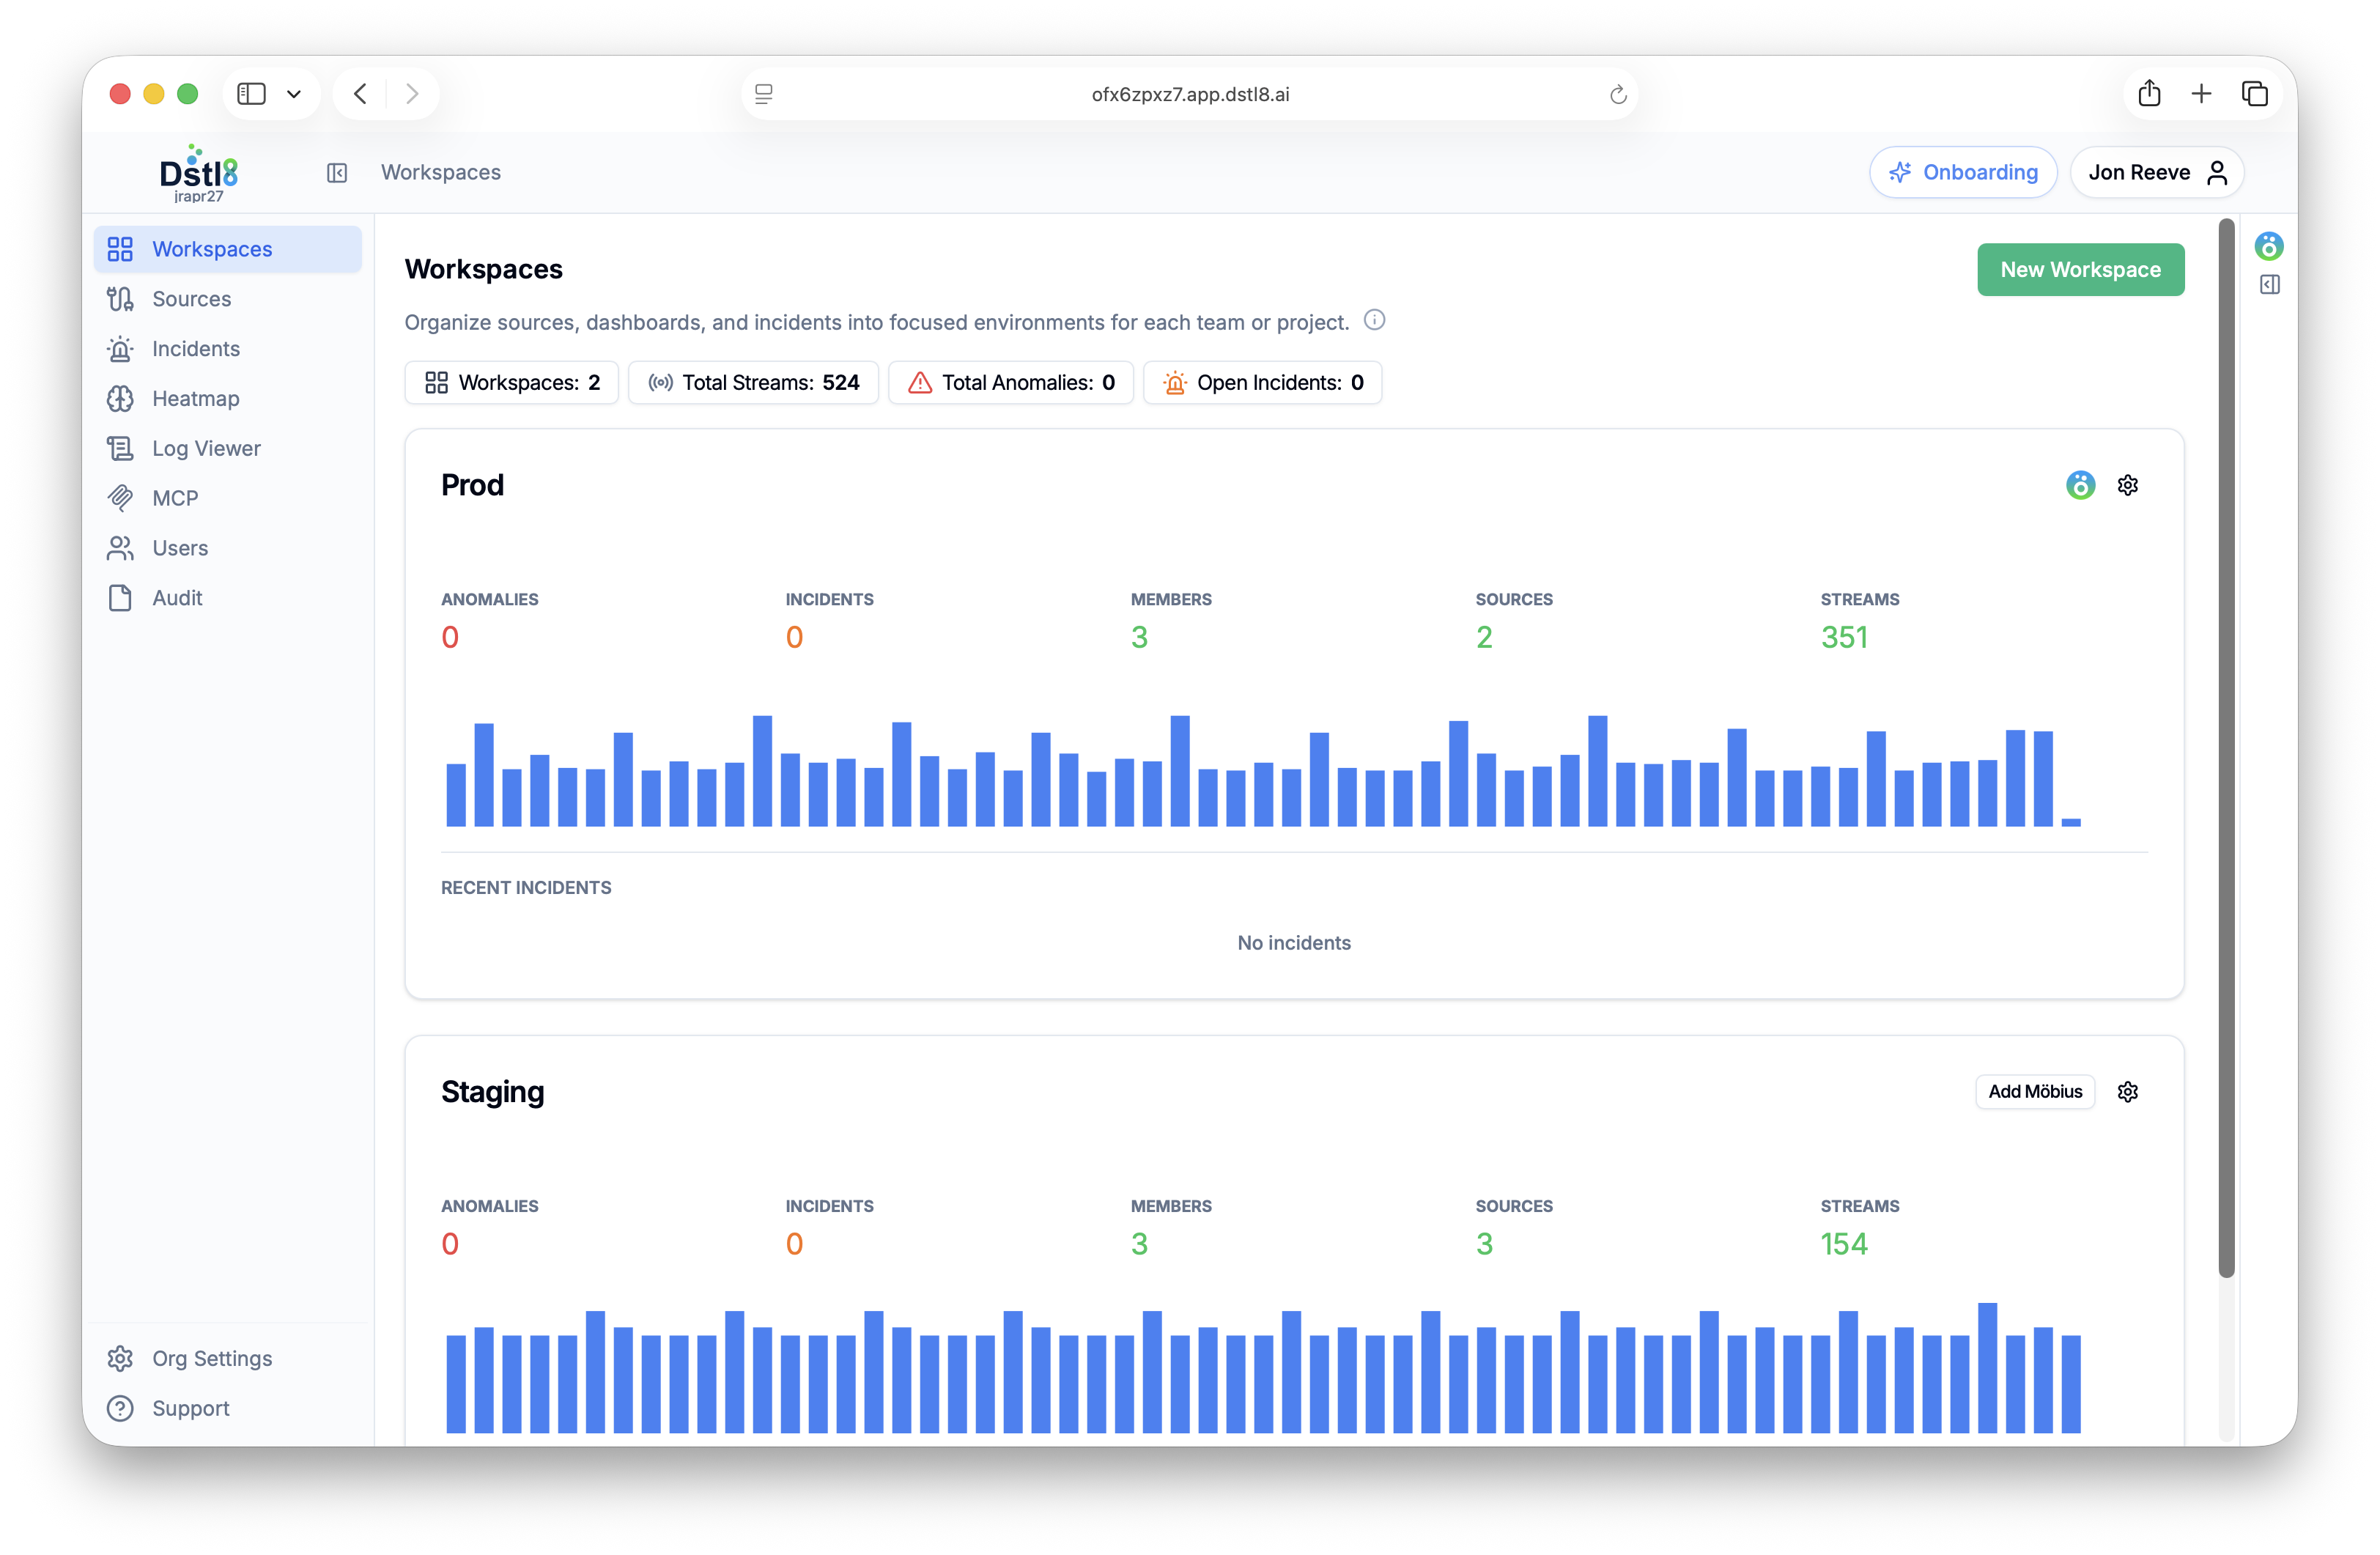
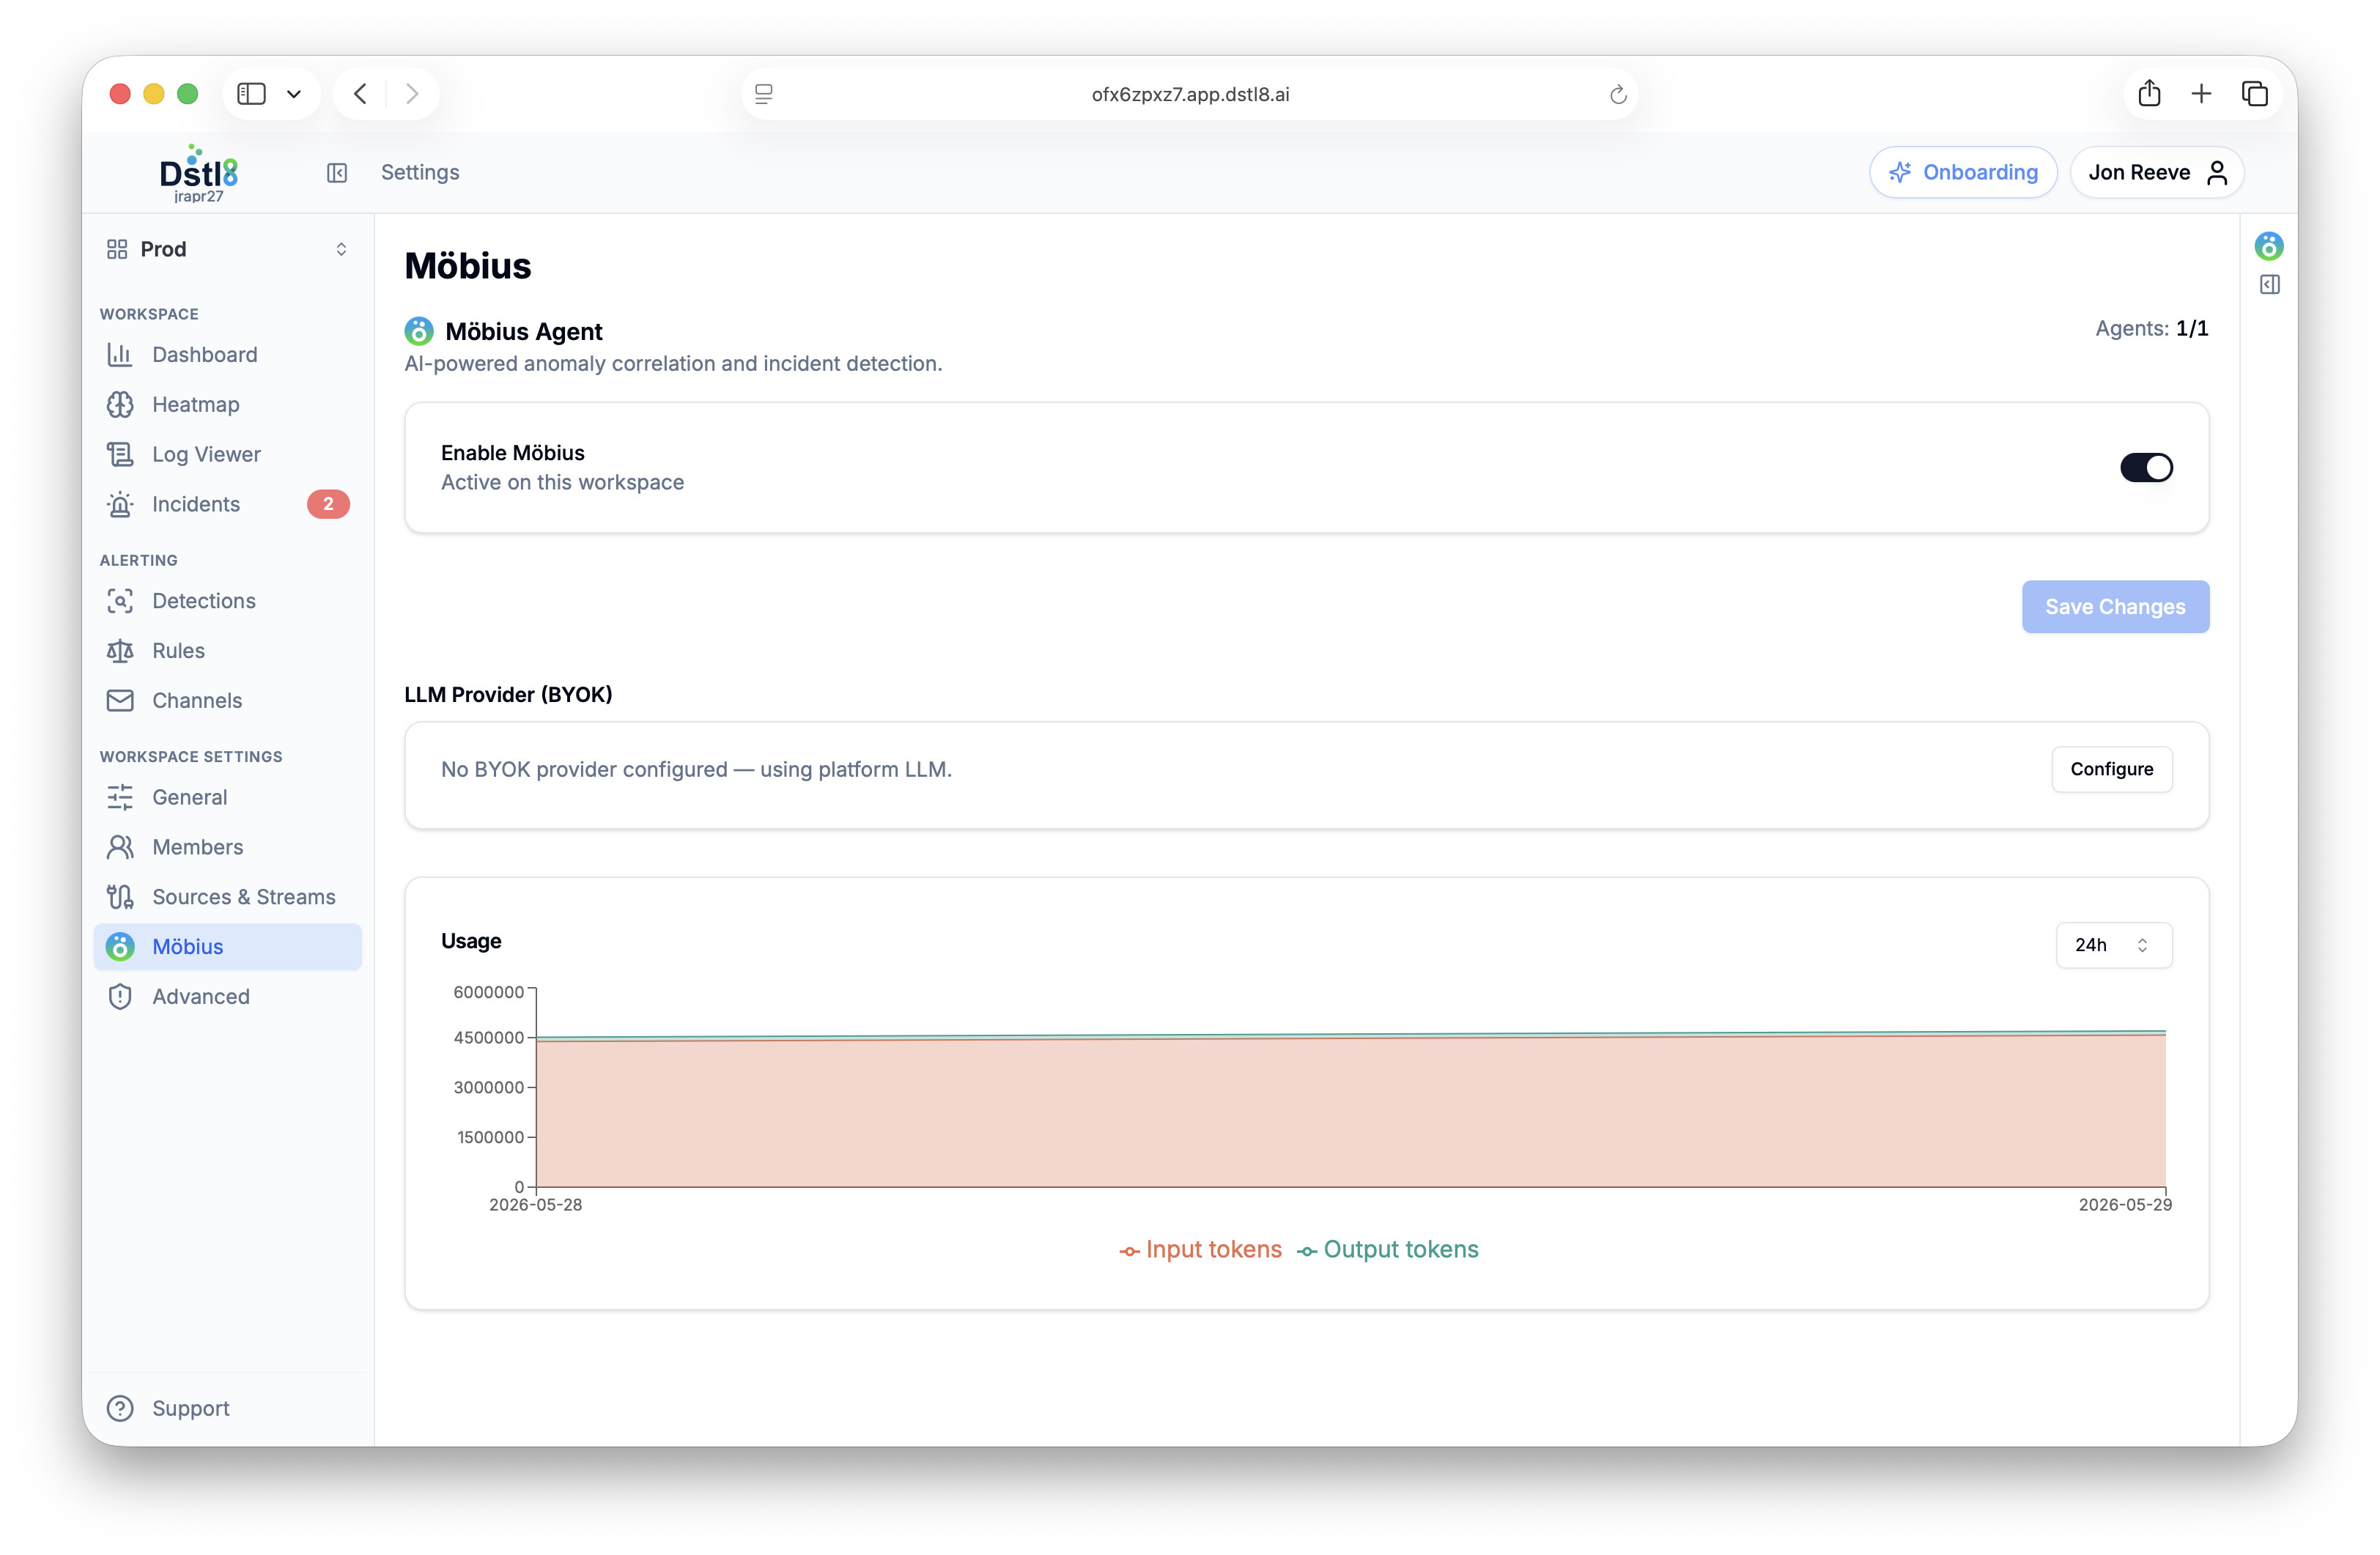
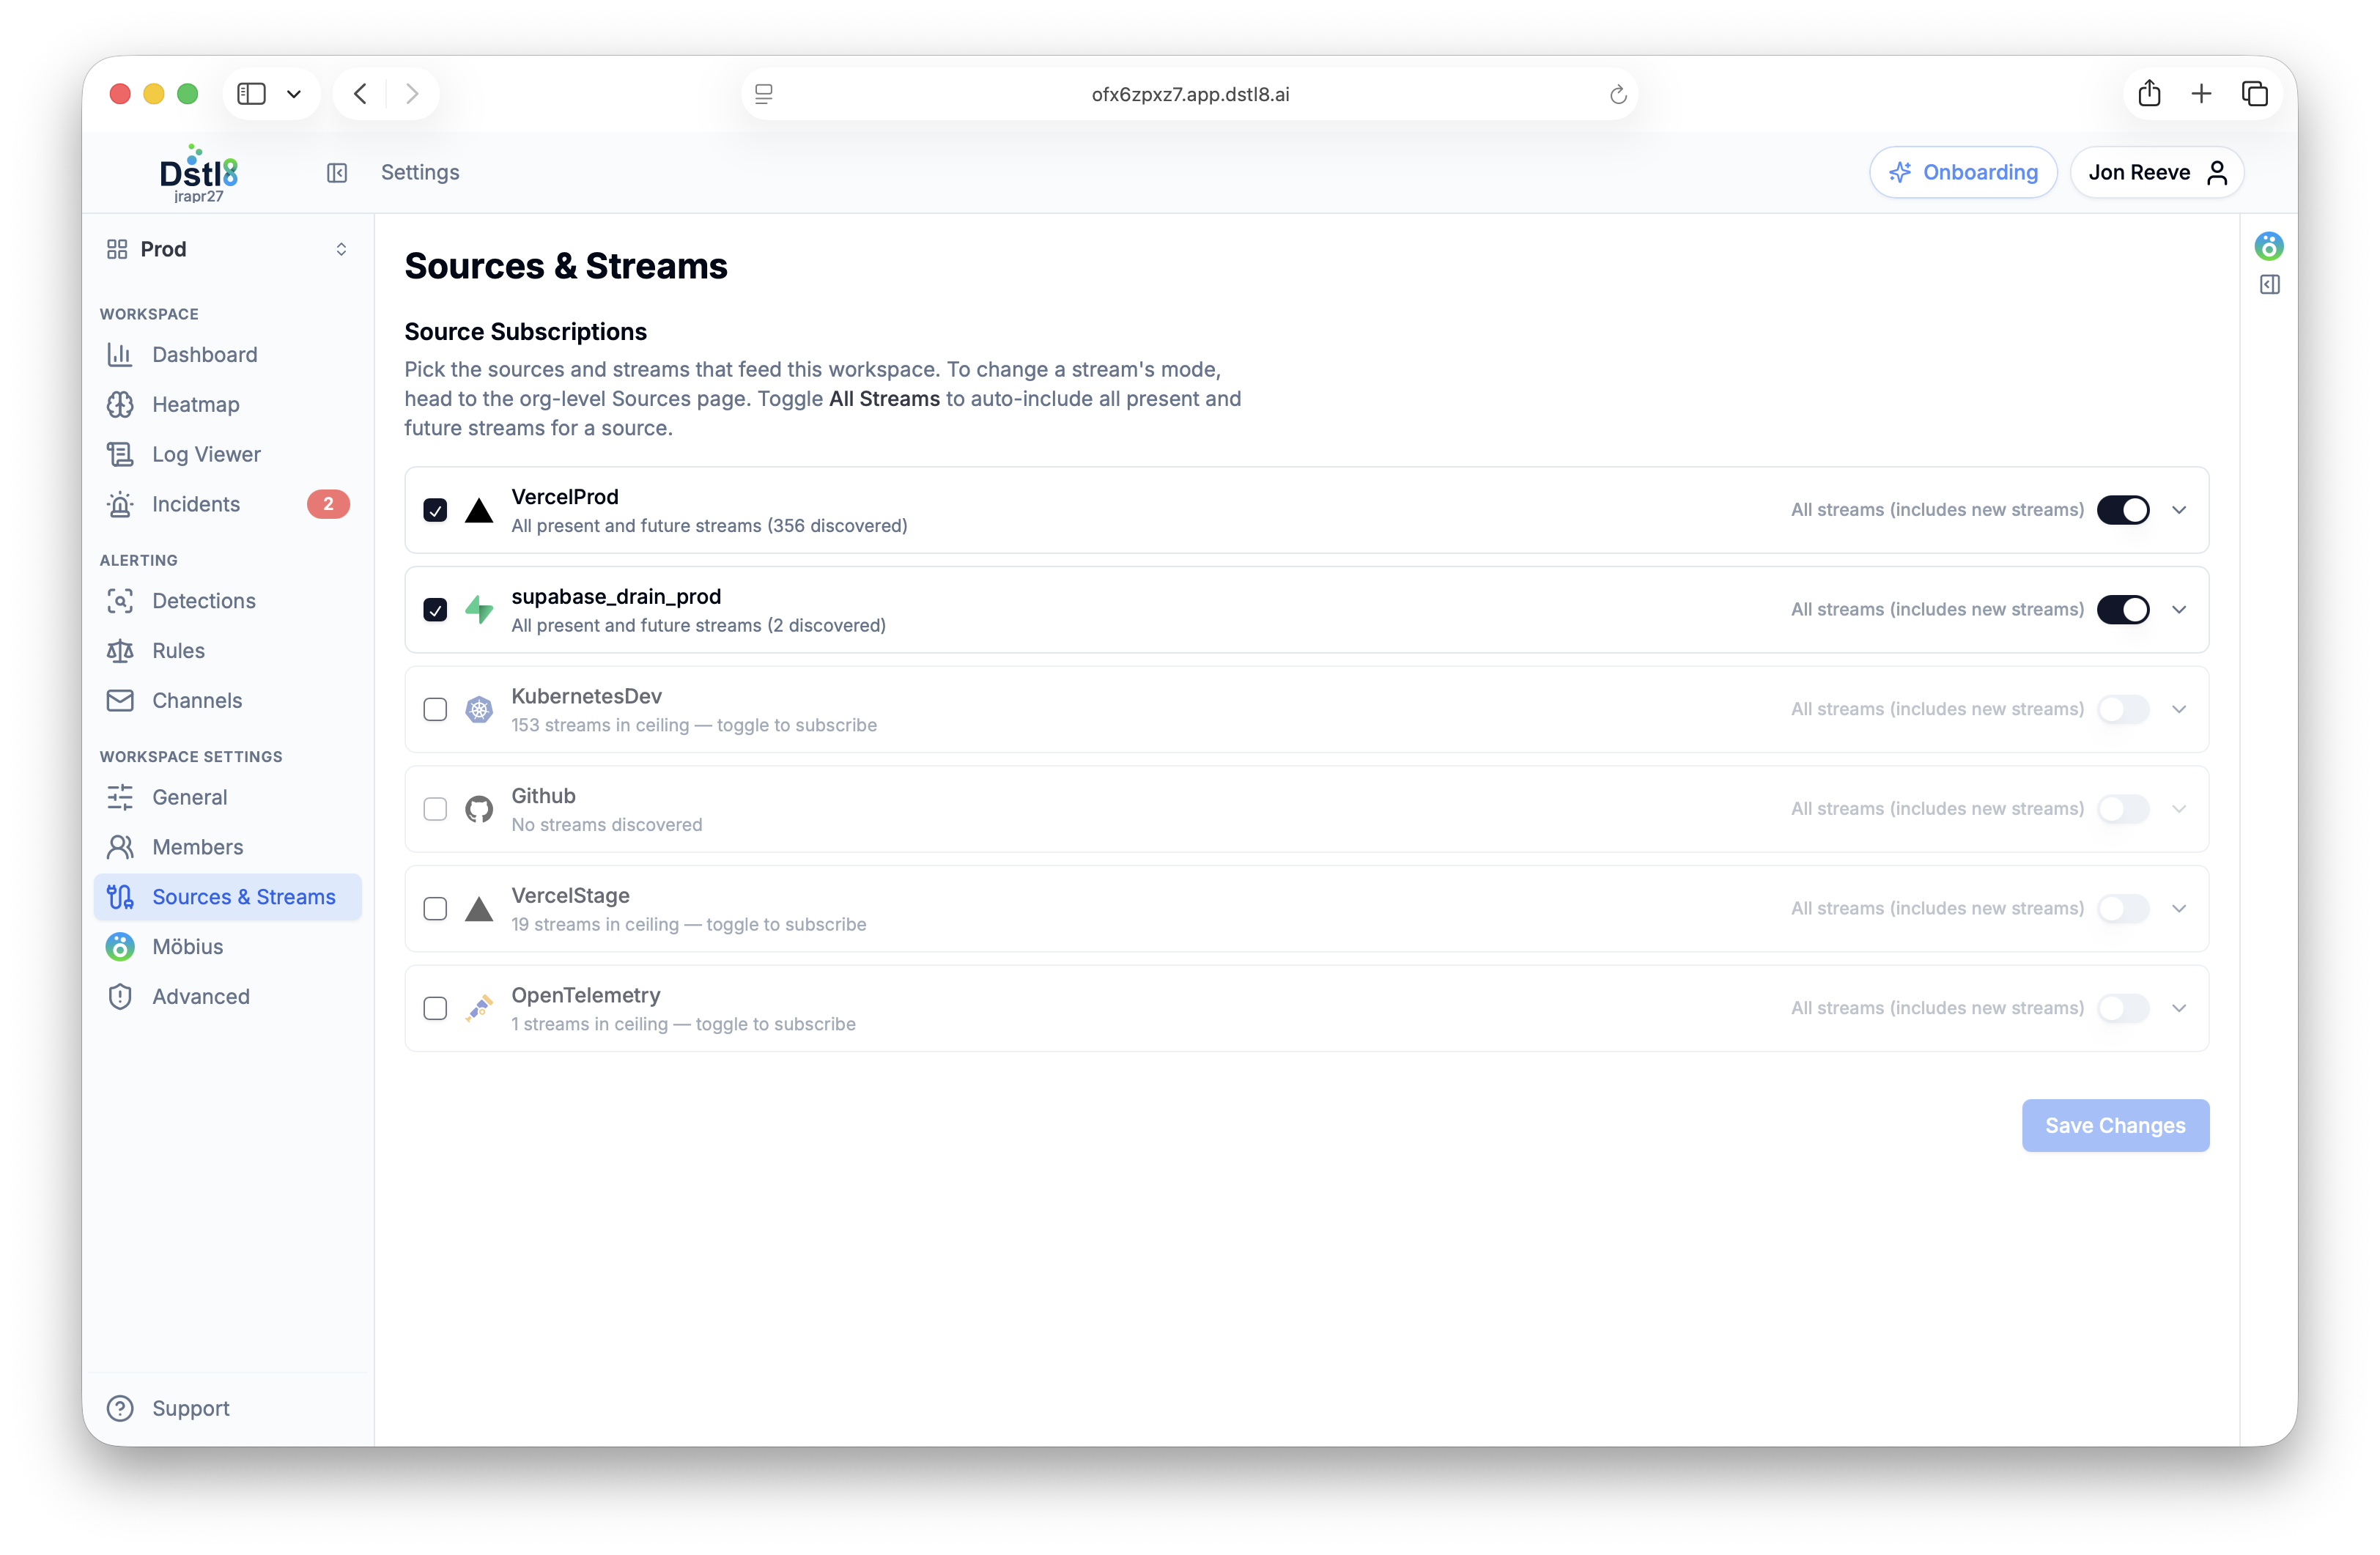
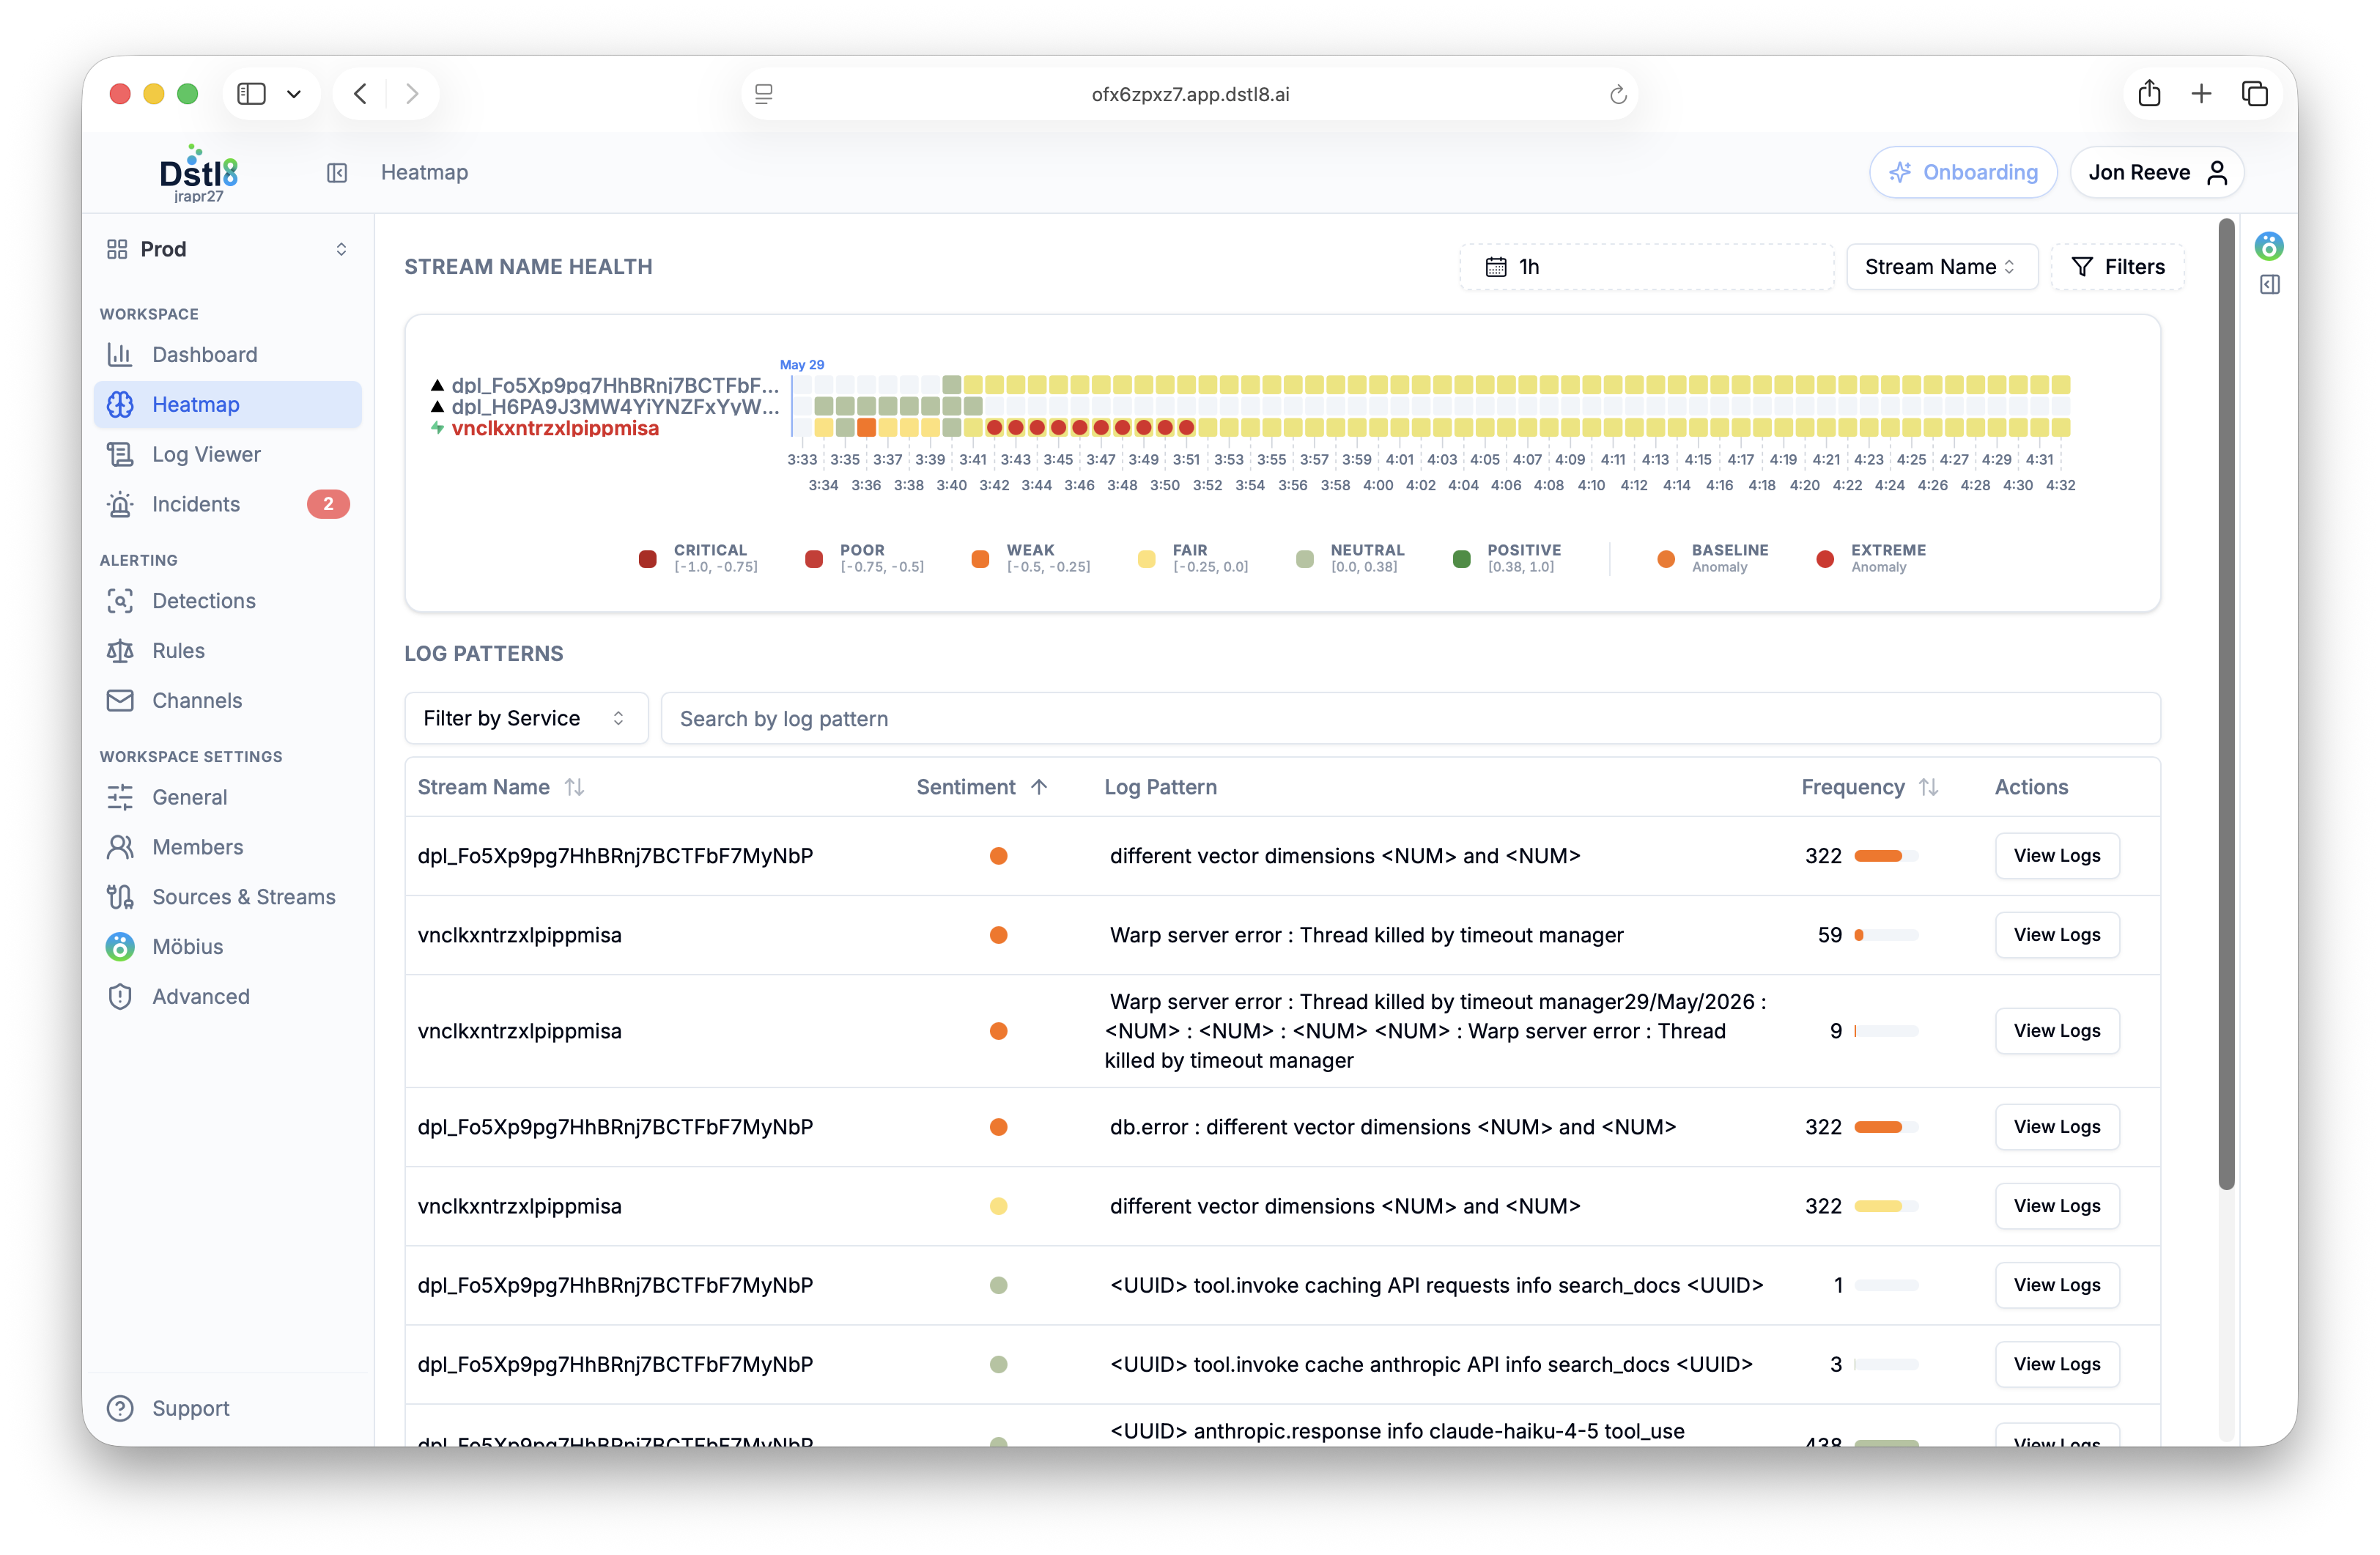
See it in the product
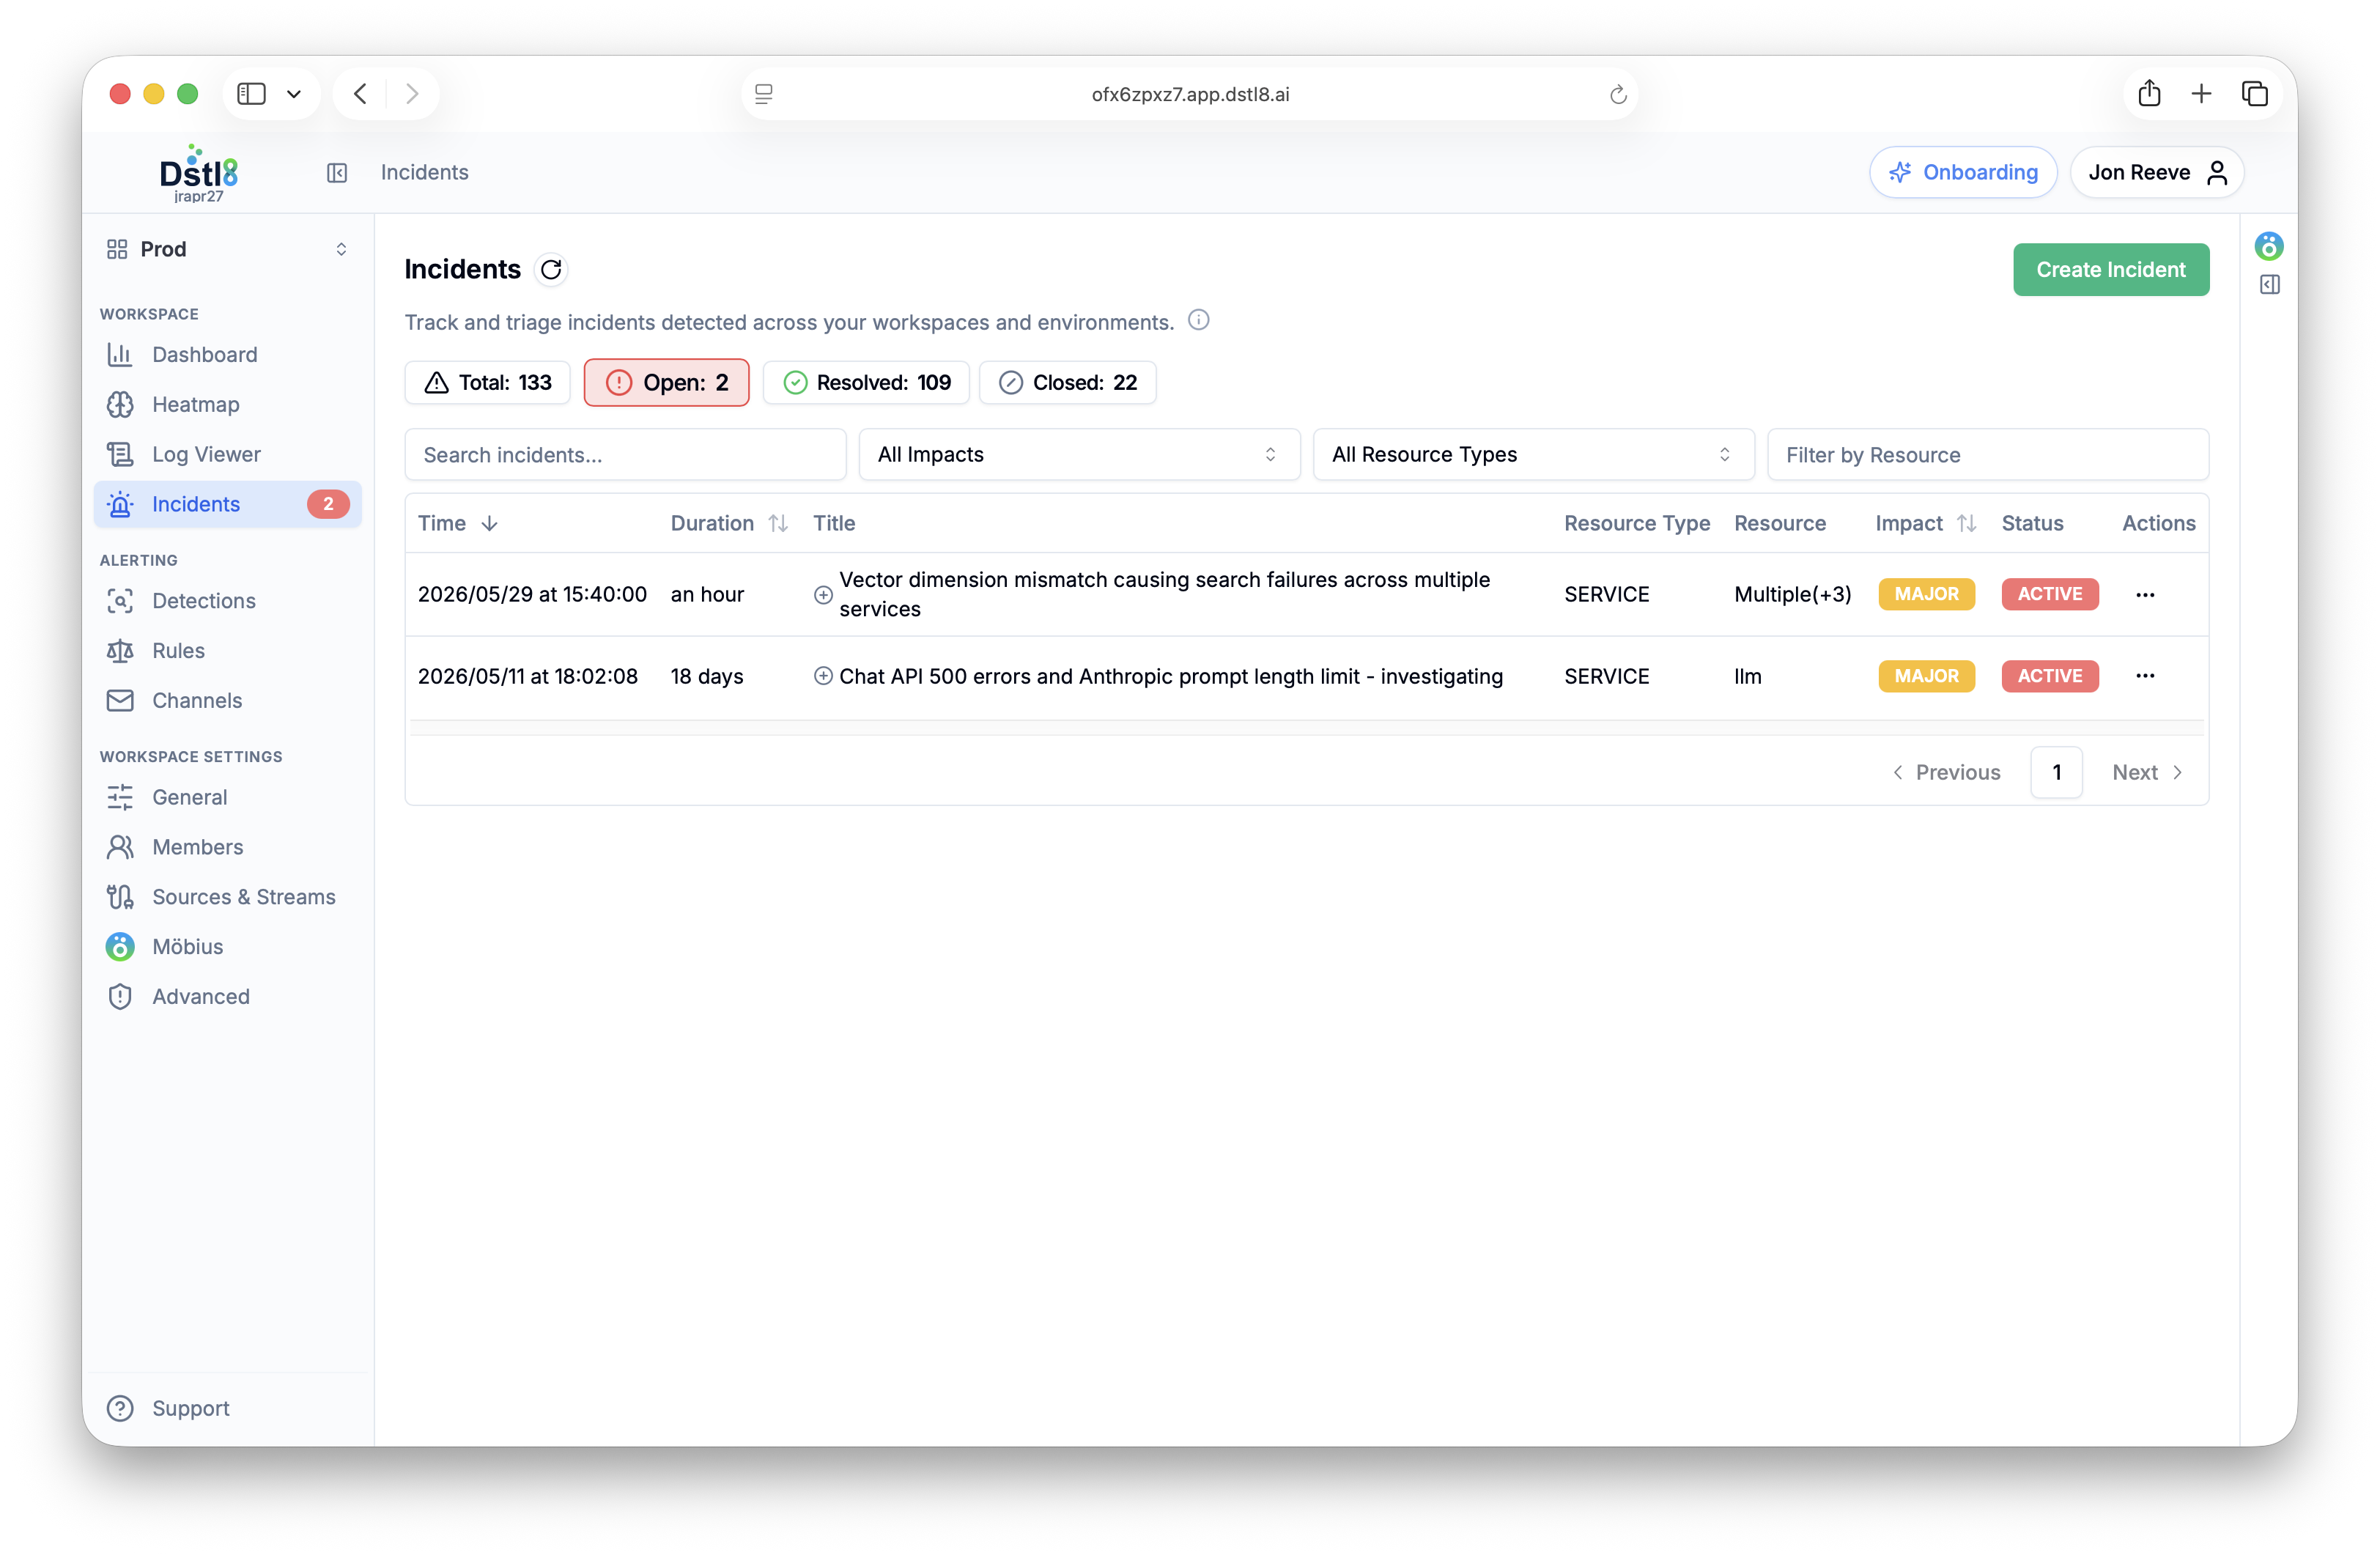
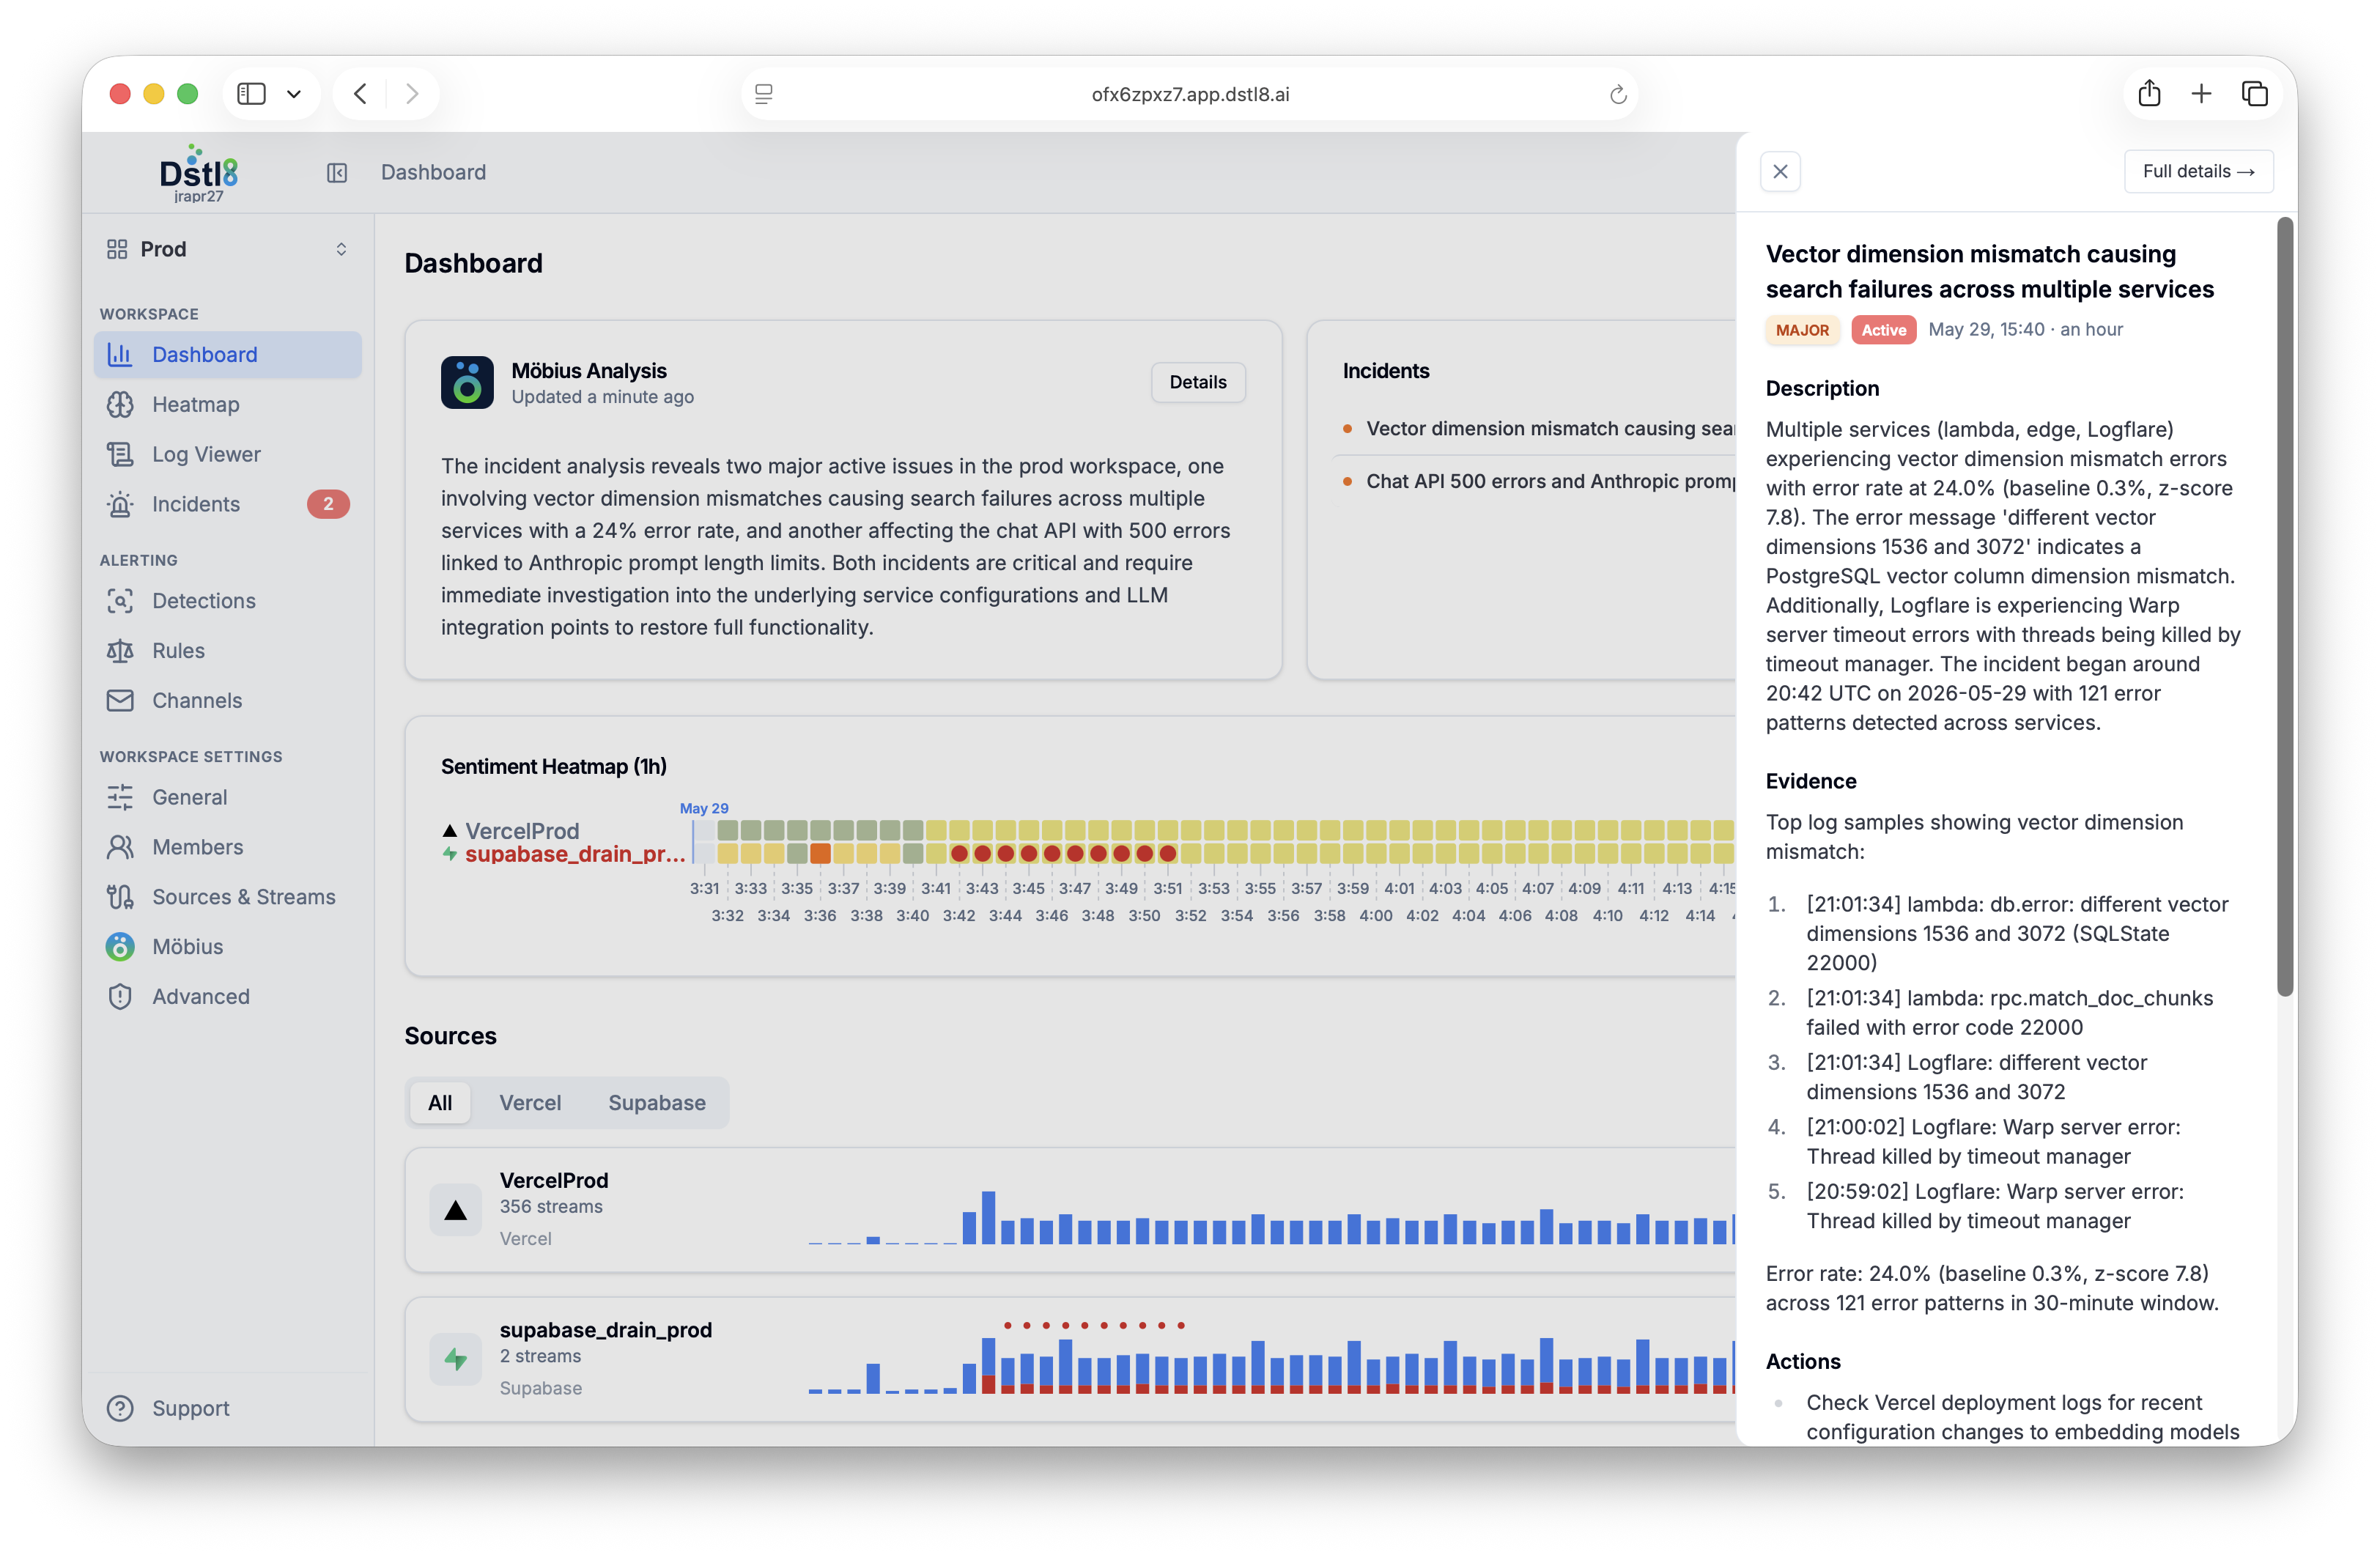
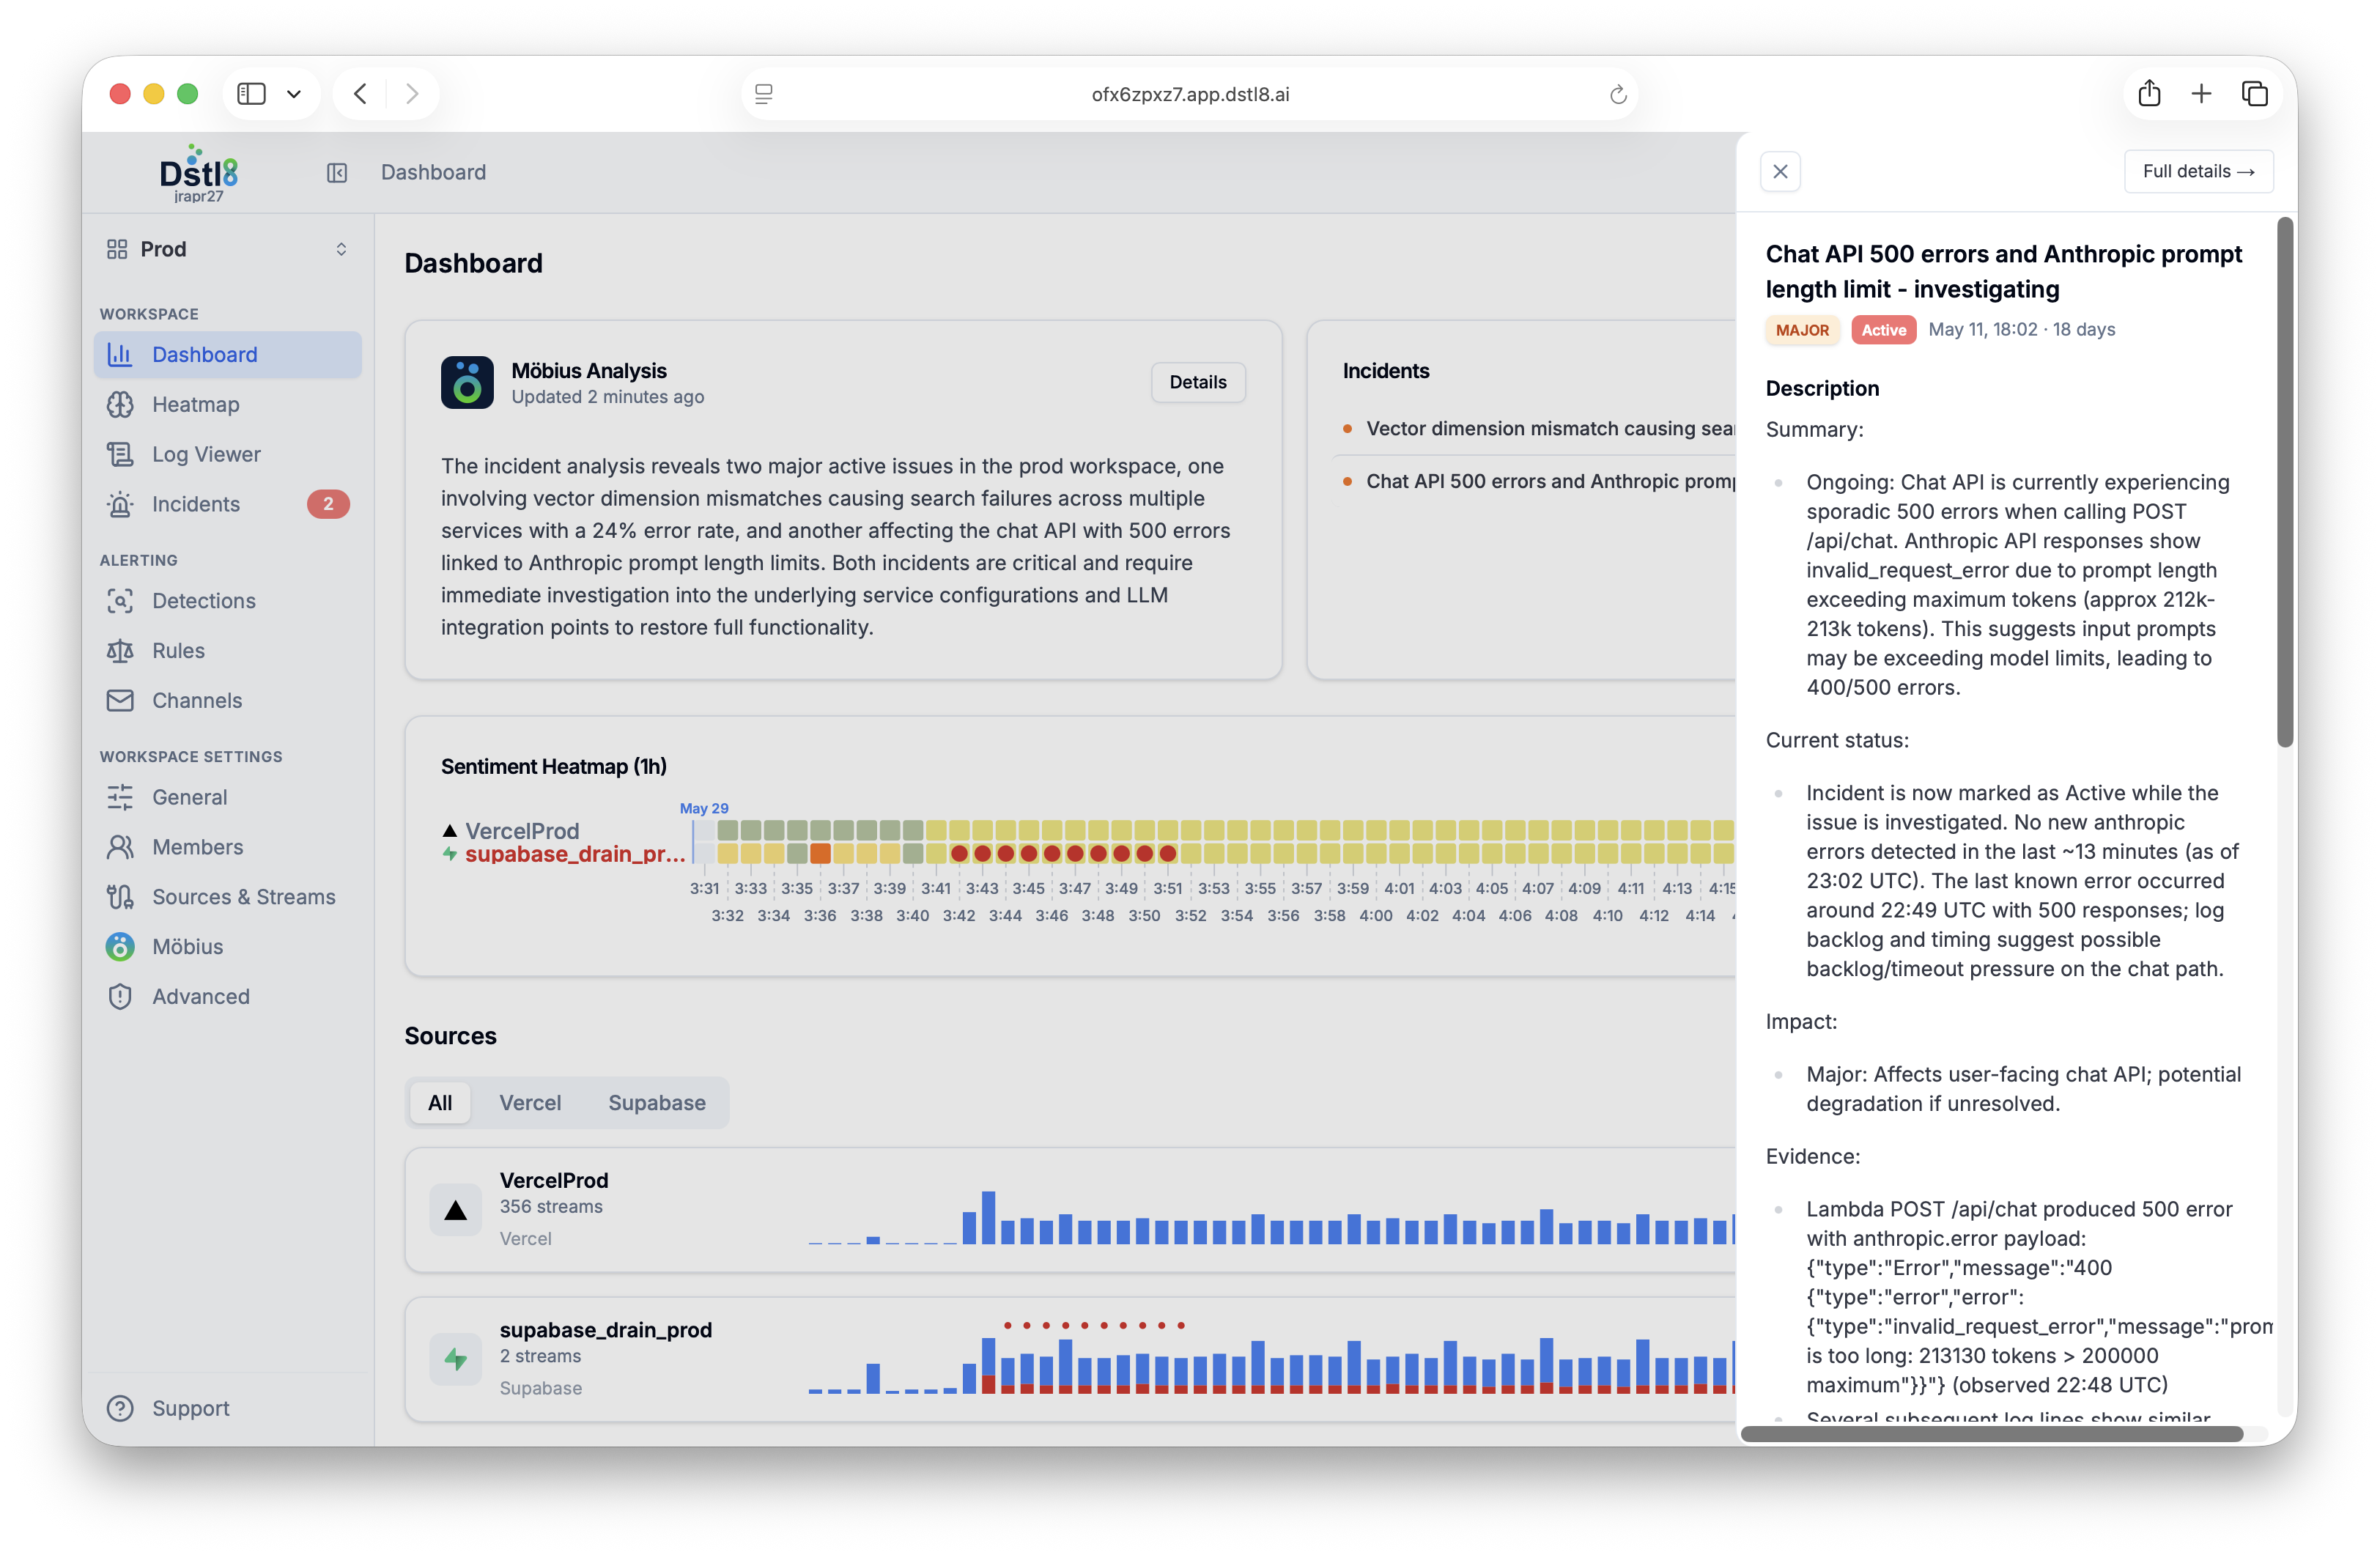
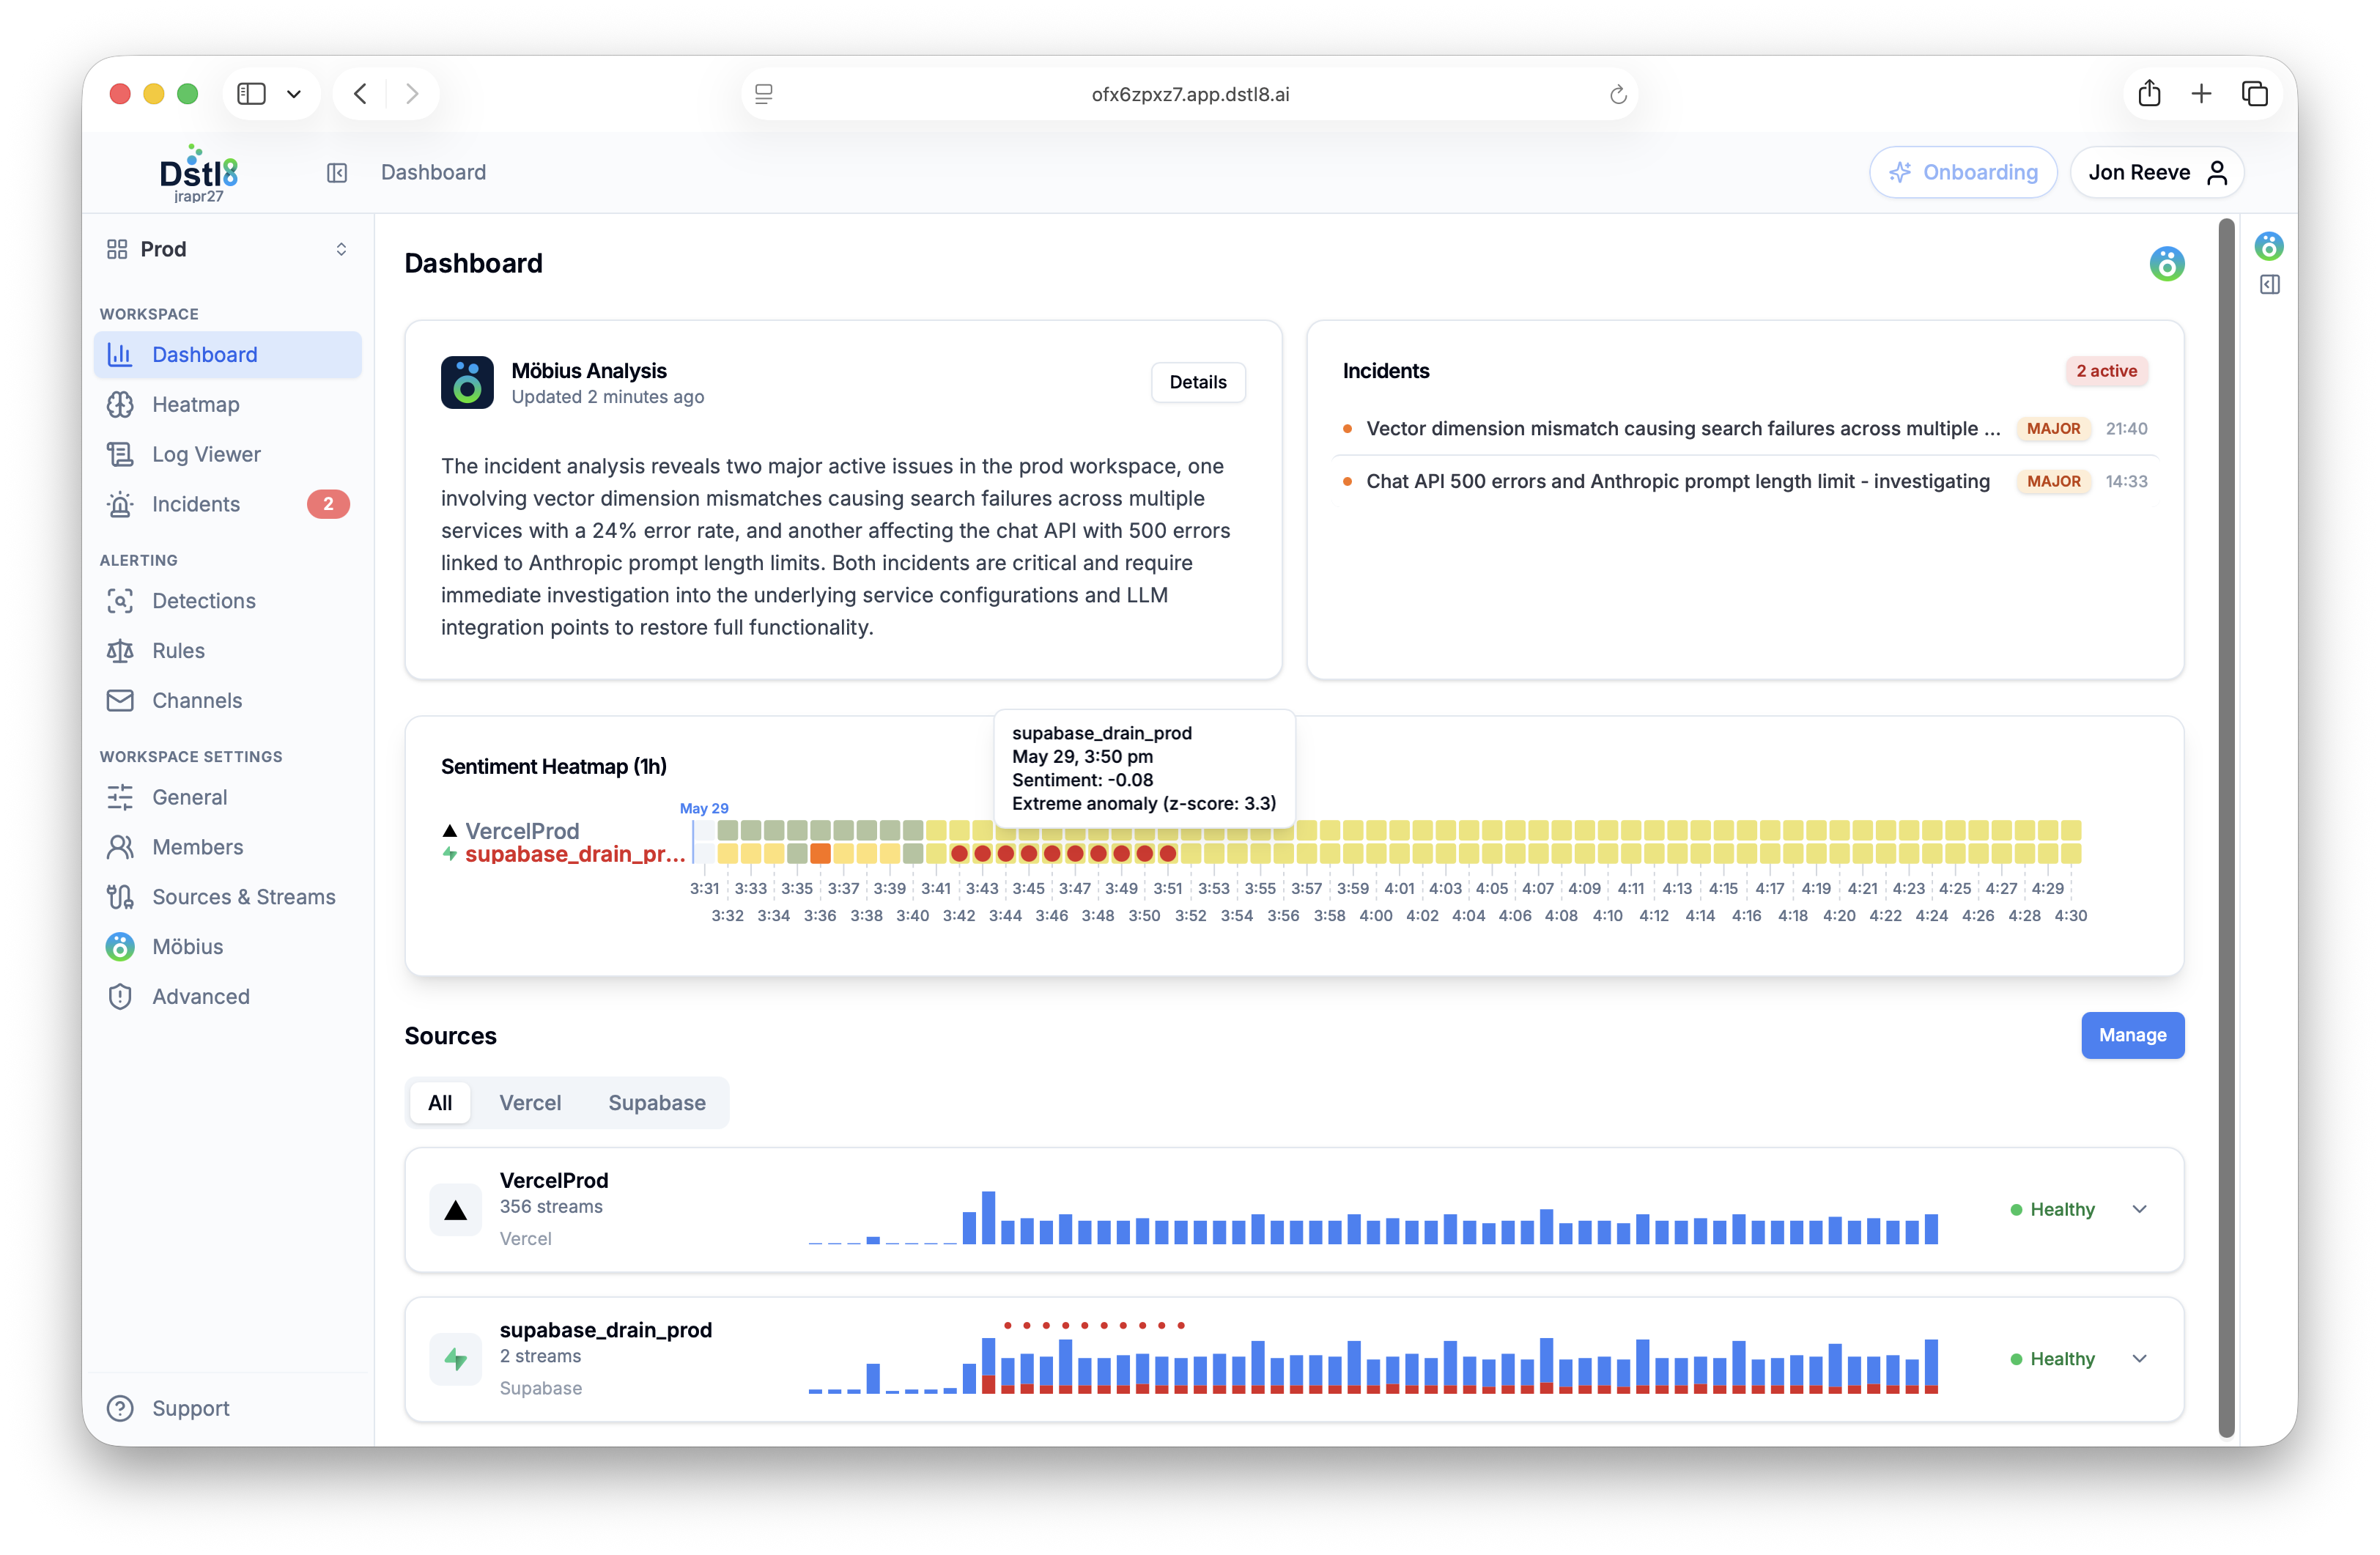
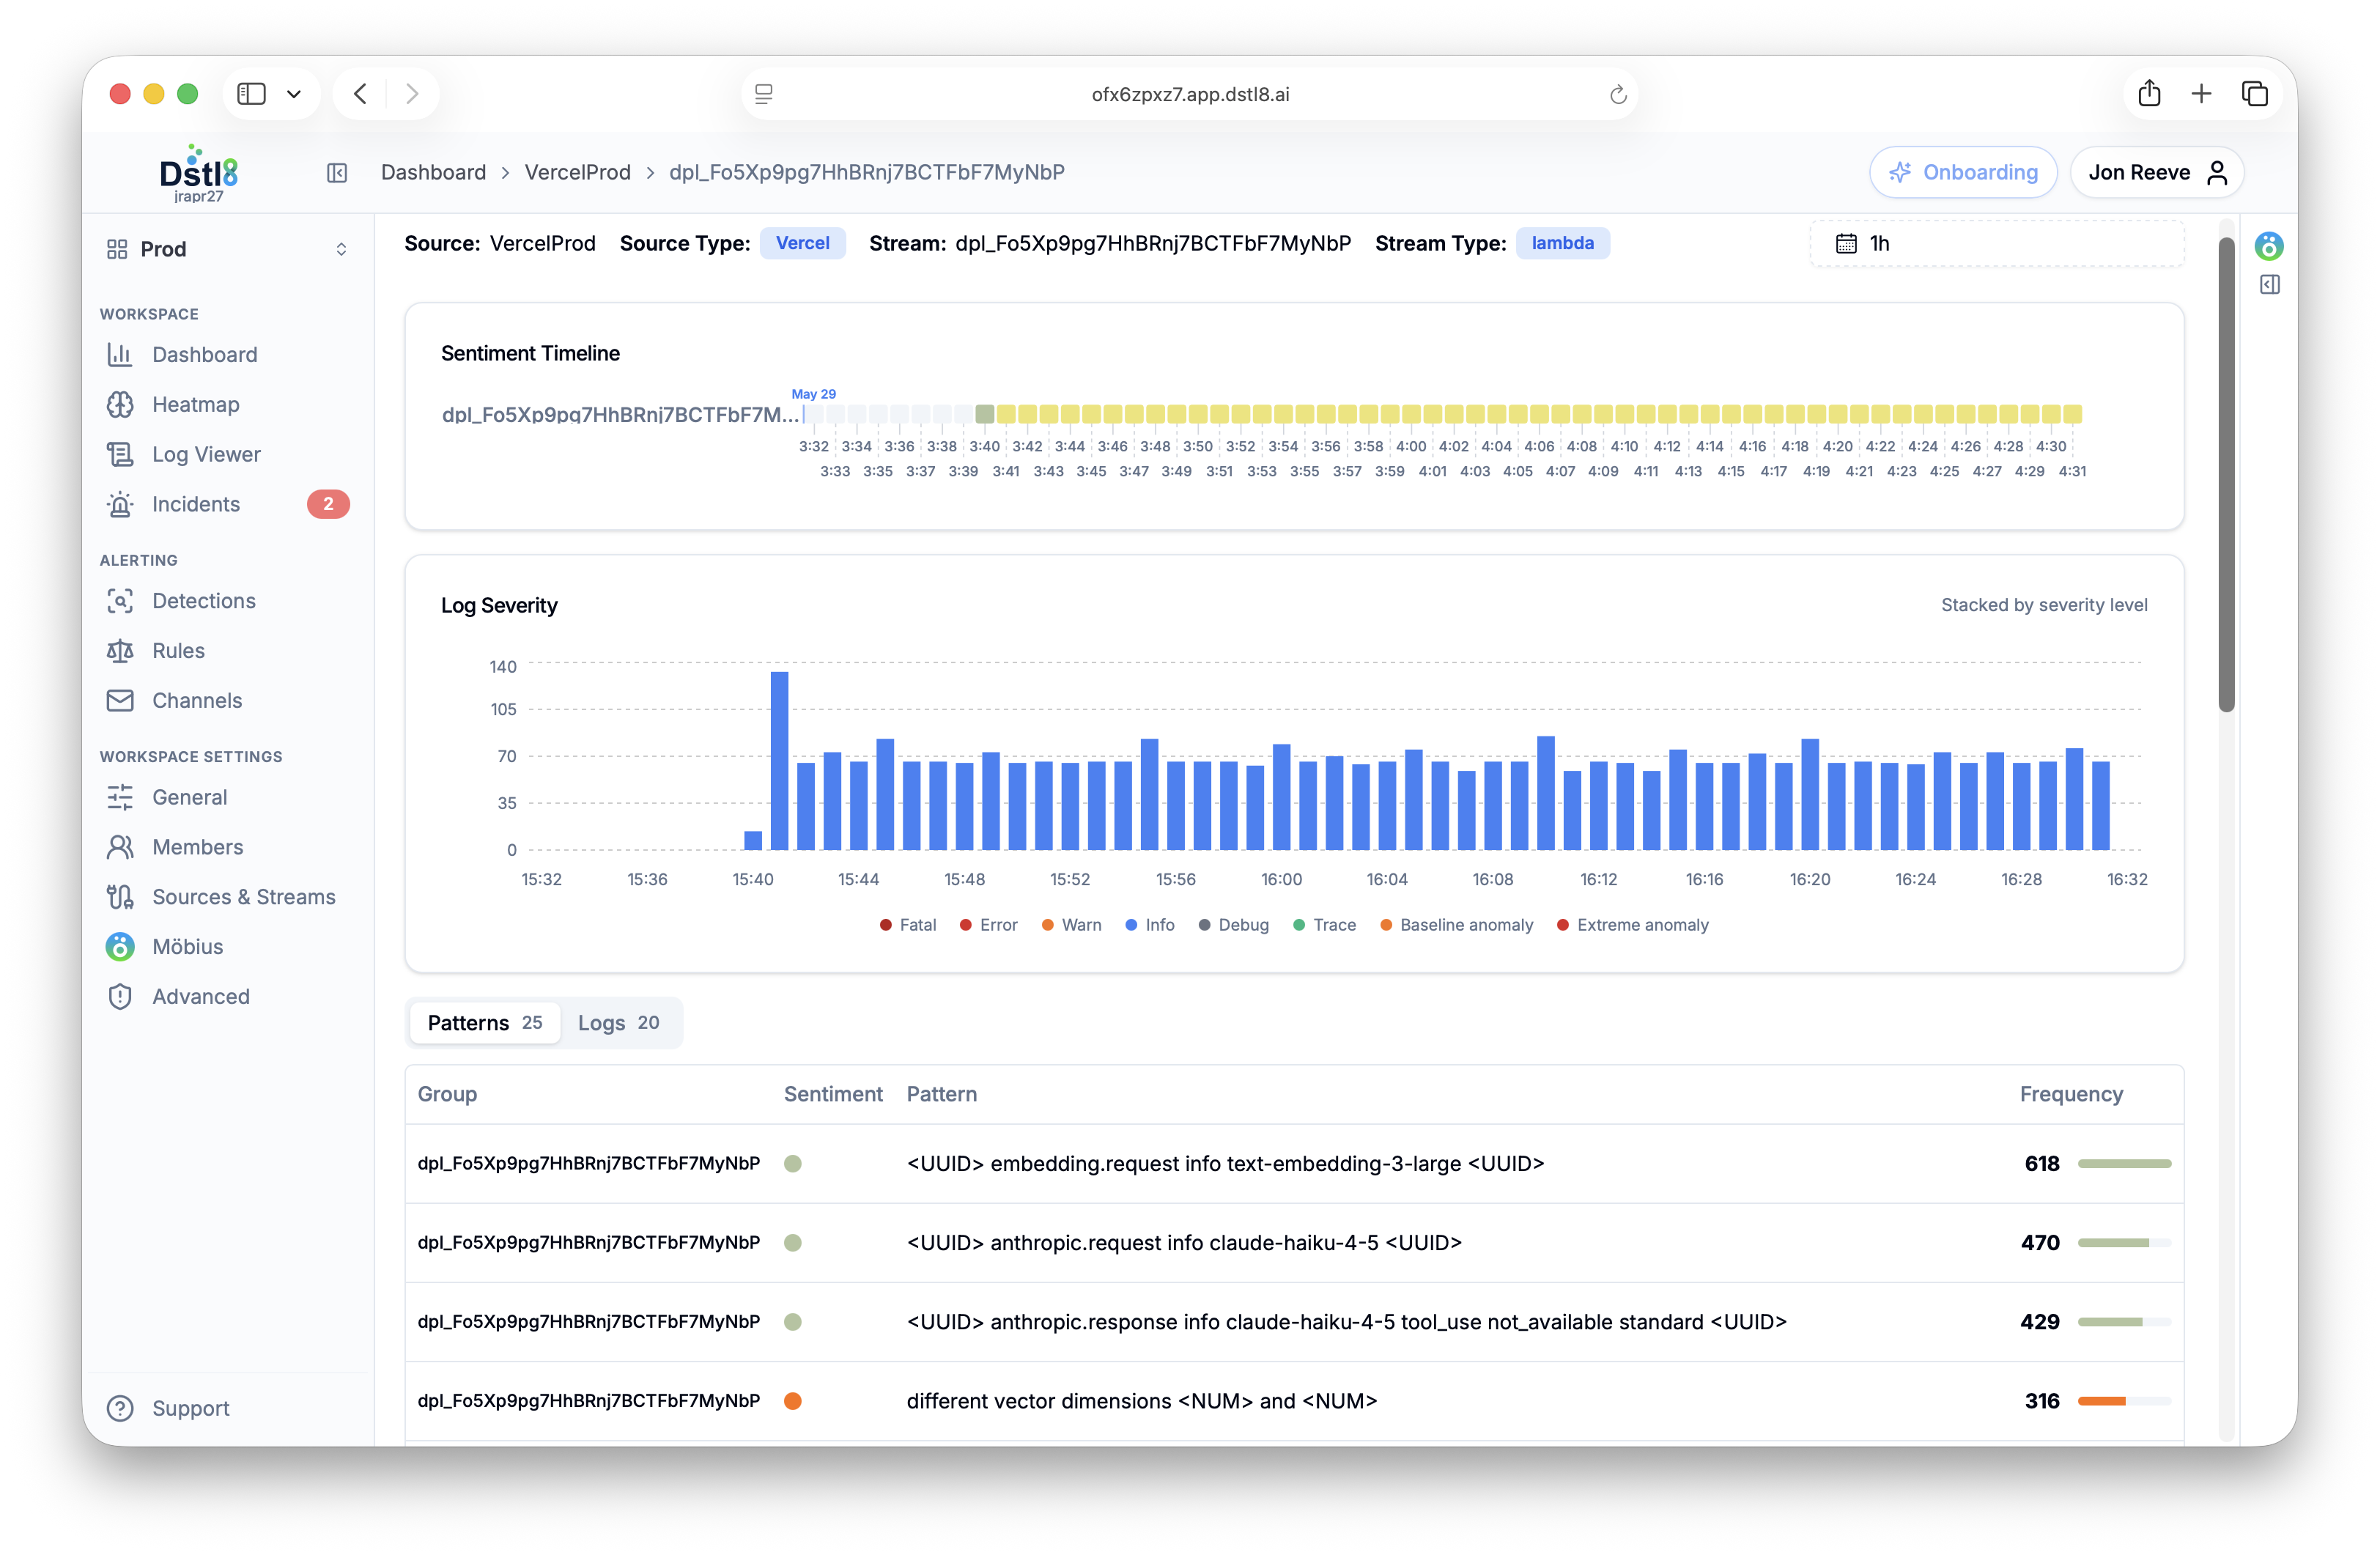
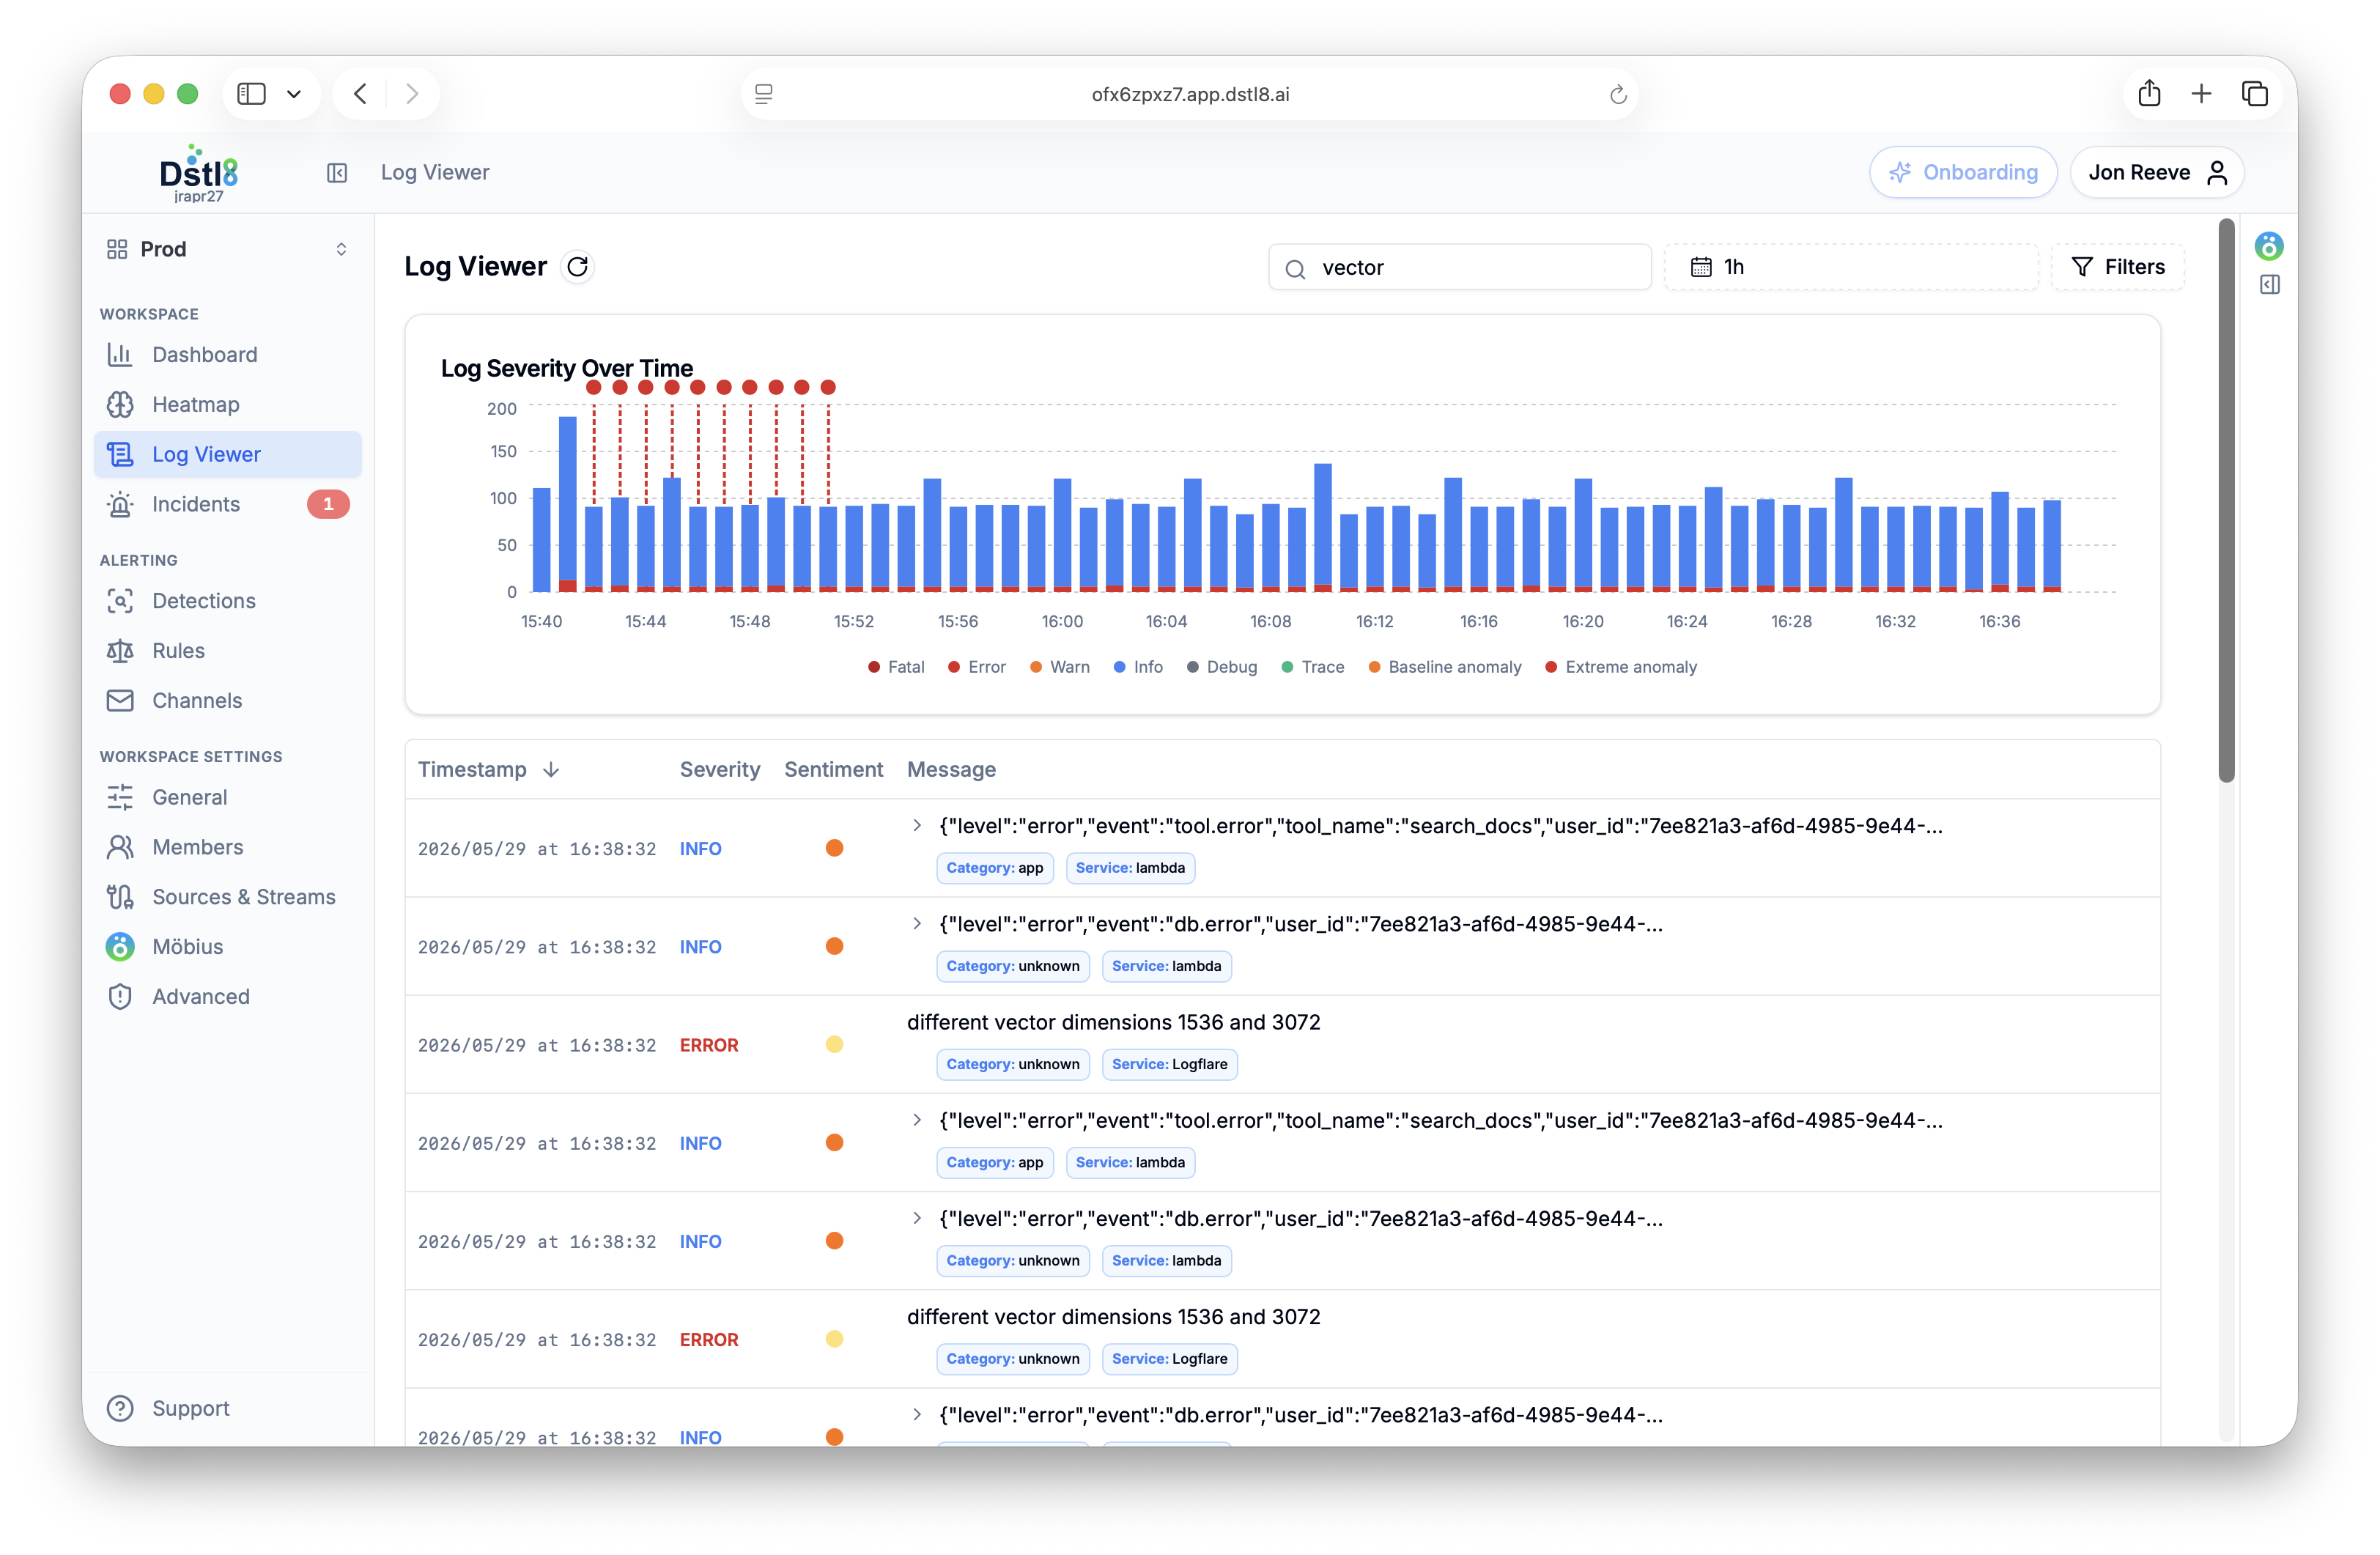
Inside Dstl8.
Service health, incidents, log patterns, and the root cause Möbius surfaces — across every deployment.
Works with your stack


Runtime platforms and AI coding tools — connected in minutes. See all integrations →
From the community
Loved by people who live in logs.
"
I asked Claude Code why the deploy broke and Dstl8 fed it the exact log lines over MCP. Root cause and a fix suggestion, without ever leaving my editor. This is the feedback loop I've wanted since I started shipping AI-generated code.
"
We pipe Kubernetes, Vercel, and CloudWatch into one stream. When something breaks I've stopped guessing which service it was. Dstl8 points me at the source and the line.
"
Five-minute setup and it was already surfacing patterns I'd been blind to. Immediately part of my stack.
"
I'd been living in Gonzo in my terminal for months and loved it. Moving up to Dstl8 was the natural next step. Same instincts, but now the pattern detection and root cause run across all my deployments.
"
Möbius found the root cause before I'd finished reading the stack trace. Cited straight to the log line. Wild.
Built for high-velocity teams
For teams the pace already broke.
Shipping with AI coding tools
The most acute monitoring gap
AI-generated code creates novel failure modes your dashboards were never configured to catch. Dstl8 closes the gap by surfacing unknown behaviors in dev and staging — before they page you in prod.
Deploying multiple times a day
When change outpaces config
Modern velocity outpaces manual monitor configuration — every deploy introduces behavior nobody wrote an alert for. Möbius AI watches the system as it actually runs, not as it was configured to run.
Start Here
See what’s actually happening.
Connect your deployment chain. Surface emergent patterns. Get root cause analysis with fix recommendations — right in your editor.
↻ Intelligence that compounds — every runtime signal makes the next one sharper.
Dstl8 — Supabase runtime analysis


Open Source
Not ready for Dstl8? Start with Gonzo.
Free, open source log analysis TUI. Real-time charts, pattern detection, AI-powered insights — right in your terminal. No account, no config.
brew install gonzo
Start Here
Install & Configure Dstl8 in Under 2 Minutes.
Try the Dstl8 CLI and TUI for continuous runtime feedback. Install it, add sources, connect the MCP server into Claude Code, and more.
brew install control-theory/dstl8/dstl8
dstl8 signup
curl -fsSL https://install.dstl8.ai/script/dstl8-cli | shnpx dstl8nix run github:control-theory/dstl8Download from https://github.com/control-theory/dstl8/releasesQuick Start
# 1. Install the CLI
brew install control-theory/dstl8/dstl8

# 2. Create a Dstl8 account (or `dstl8 login` if you already have one)
dstl8 signup

# 3. Add a source so logs flow in
dstl8 sources add vercel

# 4. Connect your AI agent, auto-detects MCP-compatible clients on your machine and configures them
dstl8 install --all
dstl8 install claude-code
Add Sources
# Add Sources

dstl8 sources add kubernetes
dstl8 sources add cloudwatch
dstl8 sources add vercel
dstl8 sources add supabase
dstl8 sources add otlp
dstl8 sources add github