As more OpenTelemetry (OTel) instrumentation is being deployed across our applications and infrastructure, we need ways of understanding the actual payloads of the telemetry being sent and received, so that we can validate what’s being sent and received, to drive accurate analysis and optimization. The OpenTelemetry collector is a powerful piece of software with many capabilities, but sometimes, there’s no substitute to “cracking open” some of the telemetry data to see what’s actually being received, or sent.
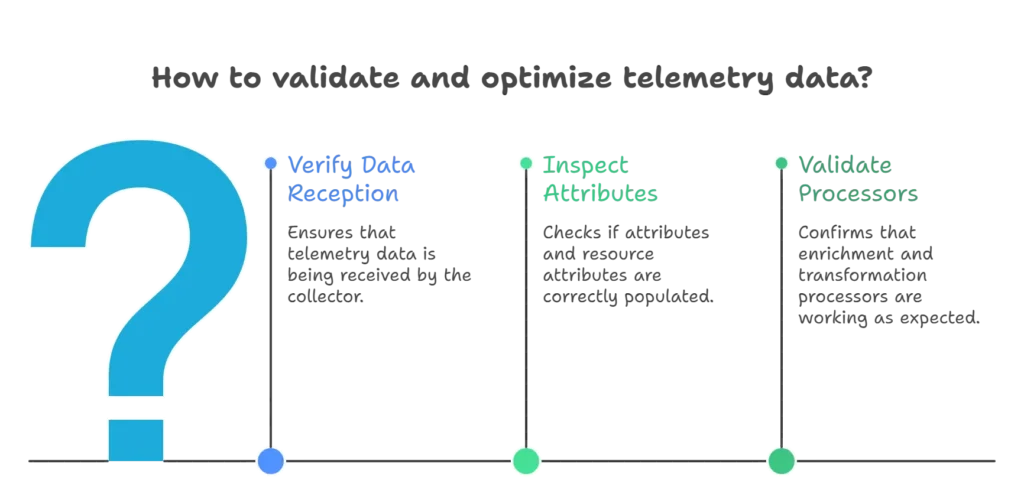
Common questions that often arise once you start with the OTel collector include:
- Is data even being received by the collector? How do I know?
- How are the OTel “attributes” or “resource attributes” associated with the telemetry (logs, metrics, traces) actually getting populated (if at all)? How can I see them?
- If I have enrichment, or other transformation/optimization “processors” in place, how do I know if they’re working and that I’ve configured them correctly?
The OTel Remote Tap Processor
The Remote Tap Processor is currently part of the OpenTelemetry Contrib repo. Recall that the OTel collector simply takes a set of telemetry sources (”receivers”) and wires those to a set of destinations (”exporters”) via one or more pipelines. Those pipelines can be configured with “processors” to enrich, transform and optimize the telemetry as it flows through the pipeline. The remote tap processor is a type of processor that samples a subset of traffic flowing through the pipeline and makes that sample available to a WebSocket client. You can position the processor anywhere in the pipeline (order is important as we’ll see) and you can also add more than one of them – for example to sample the telemetry coming in before is it transformed, and after it goes out of the pipeline post transformation.
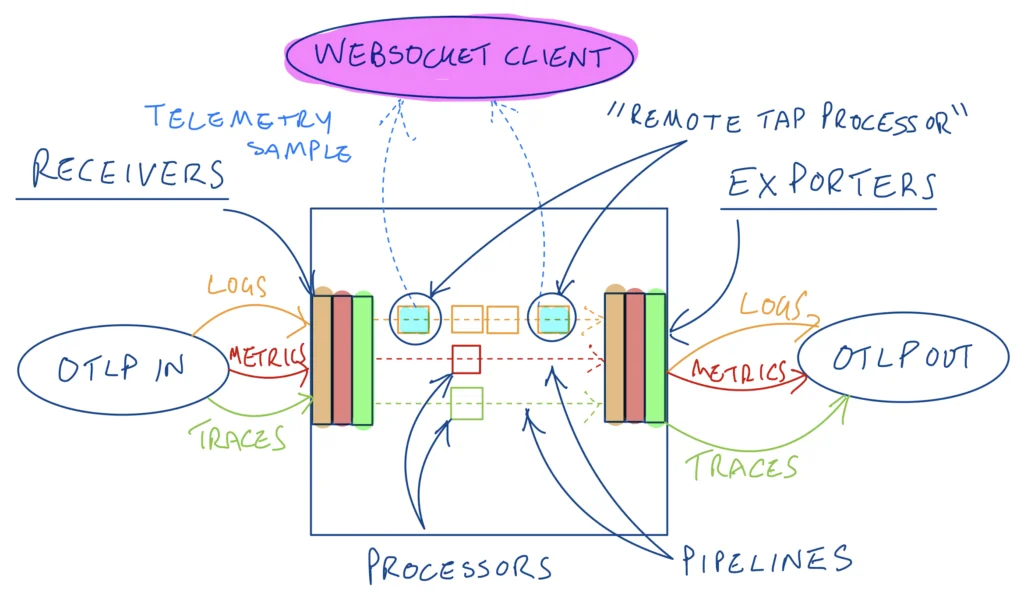
Tapping the start and end of a logs pipeline in a collector
How to Setup the Remote Tap OTel Processor?
We will use the configuration in a previous blog here as a starting point, where we optimized all three telemetry types. In the readme for the remotetap processor, we see it runs on port 12001 and listens on localhost by default, and that it rate limits the sampled telemetry to one message per second by default (this is configurable). We plan to leverage two remote tap processors here – one for the start of the pipeline and one for the end. The “start” tap processor will run on the default port and the second “end” tap processor will be configured to run on port 12002. To run the websocket client, we will use a utility called websocat available here. To run this utility from the command line to connect to the start tap processor for example, we can execute the following in our terminal:
websocat ws://127.0.0.1:12001Log Pipeline Validation
We’ll start with validating our logs pipeline. Recall that we had previously optimized our logs by filtering out logs with low level severities (< WARN), and by deduplicating them in two processors chained together. You can find the collector configuration in the following GitHub Gist
There are two Remote Tap processors defined:
processors:
    remotetap/start:
        endpoint: 0.0.0.0:12001
    remotetap/end:
endpoint: 0.0.0.0:12002and then these two processors are referenced at the start and end of the logs pipeline respectively:
service:
    pipelines:
        logs:
            exporters:
                - debug
            processors:
                - remotetap/start
                - filter/severity
                - logdedup
                - batch
                - remotetap/end
            receivers:
- otlpAssuming the OTel collector config is saved to a file called configremotetap.yaml, run the OTel collector (OTel collector contrib) as a Docker container as follows:
docker run -v $(pwd)/configremotetap.yaml:/etc/otelcol-contrib/config.yaml -p 4317:4317 -p 4318:4318 -p 12001:12001 -p 12002:12002 otel/opentelemetry-collector-contrib:latestNote that in addition to the two OTLP receiver ports (that we’ll send telemetry traffic to), we have also exposed the ports for the two remote tap processors, so that we can connect to them with our WebSocket client.
Generate Telemetry
We’ll be using the handy otelgen tool again to generate OTel telemetry to send to the OTLP receiver defined in the collector configuration. You can install this locally or run it as a container. For example, to generate logs using Docker and direct them to the OTLP receiver running in our other container (on our mac):
docker run --rm ghcr.io/krzko/otelgen:latest --otel-exporter-otlp-endpoint host.docker.internal:4317 --insecure logs mLet the logs (samples) flow!
Now we can use the websocat client to see the sampled logs from the start remote tap processor (i.e. the incoming logs before they are transformed in our pipeline) in our terminal – we’ll also use jq to make these more readable, like:
websocat ws://127.0.0.1:12001 | jq '.'You should see something like the following – we can already see useful information including the aforementioned resource attributes (in this case from K8s) and attributes. We can also see the log severity in here – which one of our subsequent processors will filter on.
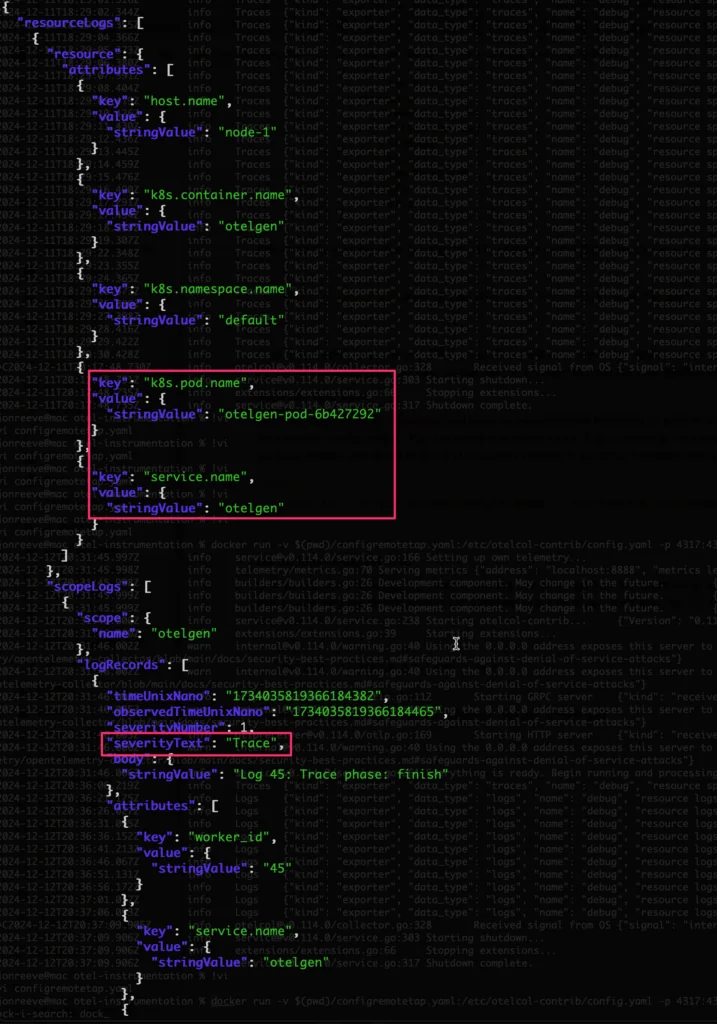
Introspecting the Logs JSON
Start and End
Let’s now validate the 1st of the optimization processors in our logs pipeline – recall that this is a filter to remove logs with severity < WARN – from our config:
    filter/severity:
        logs:
            log_record:
- severity_number < SEVERITY_NUMBER_WARNLet’s validate if this is happening – in one terminal for the start tap processor, run:
websocat ws://127.0.0.1:12001 | jq '.' | grep severityTextand in the other terminal – for the end tap processor, run:
websocat ws://127.0.0.1:12002 | jq '.' | grep severityTextYou should see something like:
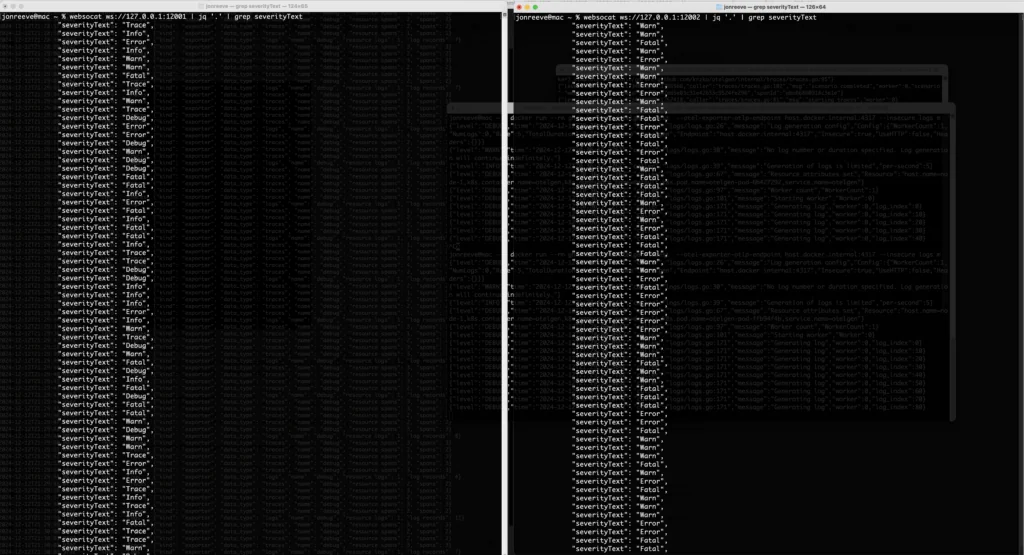
Logs In (left) vs Logs Out (right)
i.e. you should only see “TRACE”, “DEBUG”, or “INFO” logs at the start of the pipeline and not at the end, if they have been successfully filtered out.
Log DeDuplication Verification
Let’s also revisit the log deduplication processor in our config:
    logdedup:
        interval: 5s
        log_count_attribute: dedup_count
timezone: America/ChicagoAccording to the readme for this processor, the attribute defined as dedup_count above, should get injected into our log messages by the deduplication processor, so we should see this attribute only at the end of our logs pipeline, and not at the beginning. This time let’s run the following in our start tap processor terminal:
websocat ws://127.0.0.1:12001 | jq '.resourceLogs[].scopeLogs[].logRecords[].attributes[] | select(.key=="dedup_count")'and this in our end tap processor terminal:
websocat ws://127.0.0.1:12002 | jq '.resourceLogs[].scopeLogs[].logRecords[].attributes[] | select(.key=="dedup_count")'We should not get any results from the 1st command since that attribute should not be there yet, and we should see the attribute show up only in our second (end) terminal like:
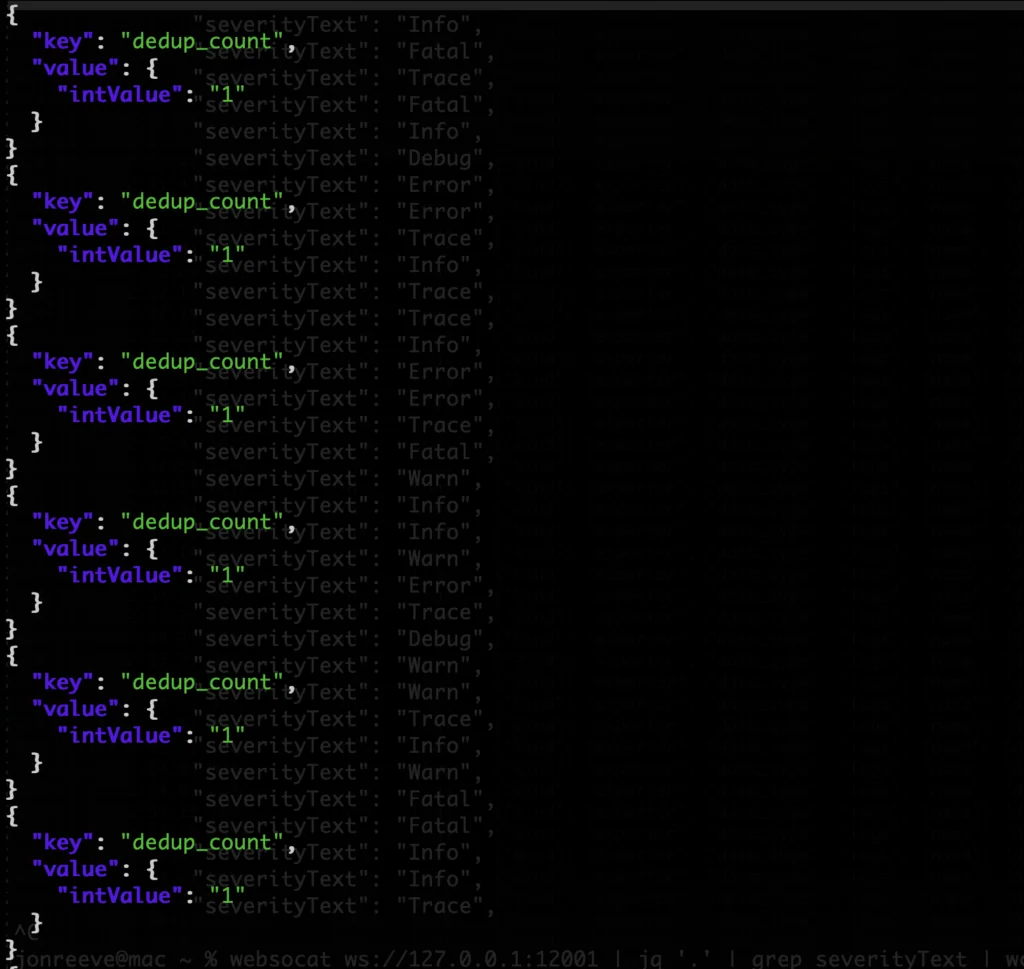
Validating the Deduplication Processor
This confirms that the processor is working (injecting the attribute), and also, that we don’t appear to be getting any deduplication of logs for this particular otelgen scenario (since the “dedup_count” is always 1).
Traces Pipeline Validation
One more example – recall that we had a “tail based sampling” processor that would only forward traces that met a latency threshold OR had errors in them. From the config above:
    tail_sampling:
        decision_wait: 10s
        num_traces: 100
        expected_new_traces_per_sec: 10
        decision_cache:
          sampled_cache_size: 100000
        policies:
          - name: test-policy-1
            type: latency
            latency:
              threshold_ms: 200
          - name: test-policy-2
            type: status_code
            status_code:
              status_codes:
- ERRORLooking at the configuration of the collector we applied from the Gist, we can see that we’ve configured the remote tap processors for the traces pipeline, the same way we did for the logs one – with the “start” tap processor as the 1st in the pipeline and the “end” tap processor at the end:
        traces:
            exporters:
                - debug
            processors:
                - remotetap/start
                - tail_sampling
                - batch
                - remotetap/end
            receivers:
- otlpIf you haven’t already – you can cancel your logs generation from otelgen – we’re going to generate traces now into the traces pipeline. Leveraging the help -h option for otelgen shows that traces generation supports various scenarios:
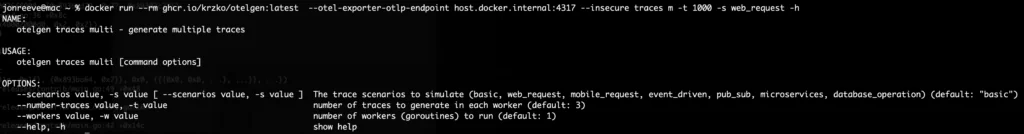
Trace Generation
We will use the web_request scenario to generate (e.g. 1000) traces like so:
docker run --rm ghcr.io/krzko/otelgen:latest --otel-exporter-otlp-endpoint host.docker.internal:4317 --insecure traces m -t 1000 -s web_requestWe can start by taking a look at some sample traces coming in to the traces pipeline with the start remote tap processor:
websocat ws://127.0.0.1:12001 | jq '.'You should see something like the following – resourceSpans objects, each with an array of spans corresponding to a given trace (id). Recall that the trace processor we set up was looking for traces with a latency greater than 200ms (above).
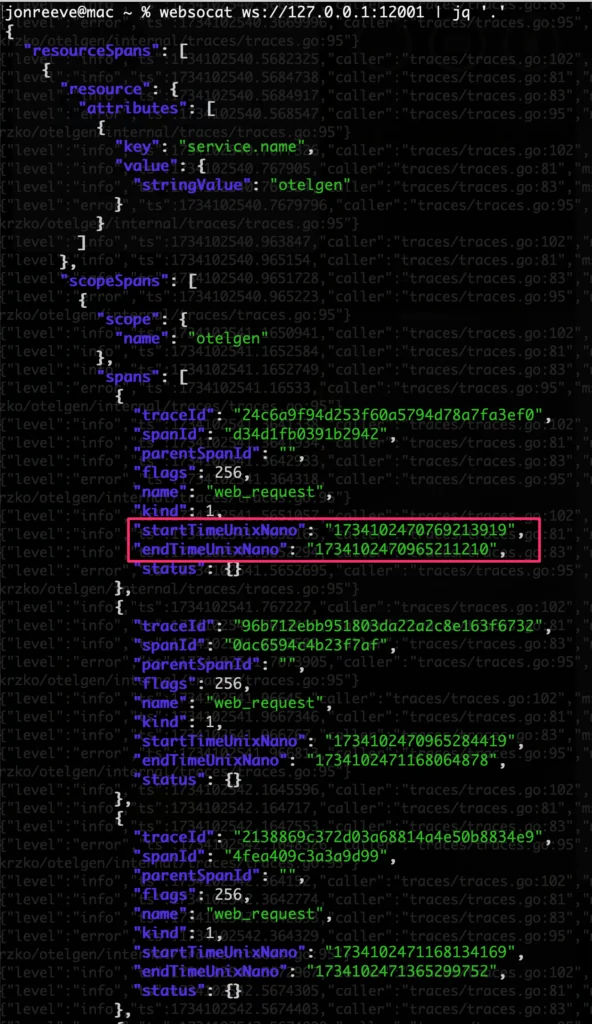
Sample Span/Trace Data
We can compute the latency on the individual spans by subtracting the start time from the end time using jq like follows:
websocat ws://127.0.0.1:12001 | jq '. |= (.duration = ((.resourceSpans[].scopeSpans[].spans[].endTimeUnixNano|tonumber) - (.resourceSpans[].scopeSpans[].spans[].startTimeUnixNano|tonumber))/1000000)' | grep durationThis computes a duration (in ms) and adds that field to the JSON, and we grep it out. Now let’s run this same command on the start and end processors as we did above, to look at the latency numbers before and after the tail sampling processor – you should see something like:
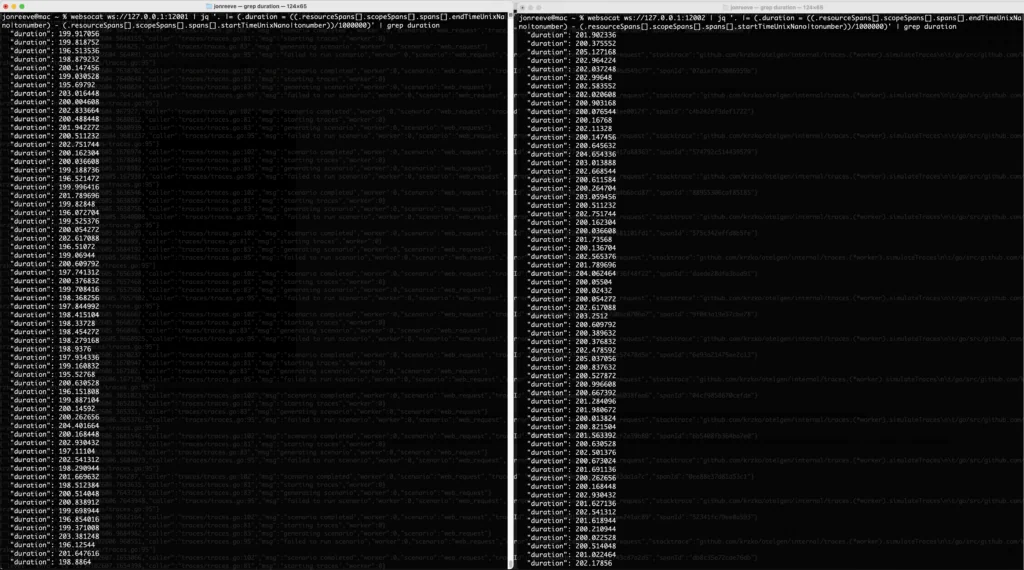
Span Latency before (left) and after (right) the tail sampling processor
We can see that the latency being reported for spans after the tail sampling processor are now all > 200ms as we expect 🙌 Astute readers familiar with the tail sampling processor will note that we are really computing span latency here, not trace latency (a collection of spans relating to the same trace id) – but if a span is more than 200ms, the trace itself must at least have that much latency, so this is a pretty good indicator that things are working as we would expect.
How can ControlTheory help you validate, analyze, and optimize telemetry?
Validate telemetry at the point of collection
We use workflows built around the OTel Collector Remote Tap Processor to show what is entering and leaving a pipeline, so teams can confirm whether receivers, attributes, filters, transforms, and sampling rules are behaving as intended.
Shorten the feedback loop with Gonzo
Gonzo gives engineers a real-time terminal environment for log analysis, with OTLP support, regex filtering, severity views, pattern detection, and AI-assisted explanation of individual log records. That makes it useful for fast validation during development and early incident investigation, especially when the goal is to see what the system is actually emitting before the data disappears into a larger telemetry stack.
Reduce noise without removing important signals
Our guides focus on using collector processors deliberately – for example, filtering, transformation, deduplication, batching, and tail-sampling – so that telemetry volume decreases while the remaining data becomes easier to interpret and cheaper to move.
Move from individual debugging to shared operational understanding
Gonzo supports individual discovery and day-to-day engineering workflows, while Dstl8 is for the team-level step: distilled evidence, impact analysis, and direct answers grounded in telemetry.
Summary
In this blog, we reviewed the need, and the power of getting at the underlying data that is flowing through the OTel collector. Whether it’s to understand the specifics of the data coming in, ensuring transformation or optimization is happening as we expect, or to simply understand if the collector is functioning! We talked about the need to be able to program our collectors “on the fly” in a previous post – the remote tap processor is another great example of that. Furthermore, getting at the underlying data that is flowing through opens up the potential of driving intelligent feedback loops that optimize the telemetry for us – think self driving for your observability 🙂 If you’re interested in learning more about this and what we’re working on, don’t hesitate to reach out!
FAQs – Optimize Telemetry with Remote Tap Processor
The remote tap processor is a diagnostic telemetry processor for the OpenTelemetry Collector. Its purpose is not long-term storage or routing, but direct inspection: it samples telemetry in flight and makes that sample available to a WebSocket client. In practice, this gives teams a concrete way to examine what their otel processors are actually doing inside the pipeline.
High cardinality describes a field or label set with a large number of distinct values, often approaching “unbounded” in production systems.
- Start with controlled input rather than production traffic. Tools such as telemetrygen and otelgen make validation repeatable.
- Expose the relevant OTLP receiver ports, typically 4317 for gRPC and 4318 for HTTP.
- Add a debug-oriented inspection step, such as a debug exporter or a remote tap processor, so you can see the telemetry rather than assume it is present.
- Confirm that attributes, resource metadata, and signal structure look correct at ingestion time.
Using remote tap at both ends of a pipeline turns a configuration hypothesis into an observable comparison. You can see what entered, what left, and which fields changed in between. That is especially useful when validating an otel collector filter processor, log deduplication, or tail sampling logic, because it reveals whether the processor chain is operating in the intended order.
- The otel filter processor is the primary mechanism for dropping low-value logs according to explicit conditions.
- The otel batch processor reduces overhead by grouping logs before export.
- The otel transform processor is suited to structured rewrites, such as masking, renaming, or conditional field changes.
- The otel attributes processor is appropriate when the requirement is attribute-level modification rather than full signal transformation.
- Resource-oriented enrichment processors add or normalize entity metadata so that downstream analysis remains coherent.
The otel batch processor is primarily a transport-efficiency control. It does not decide what telemetry to keep; instead, it changes how retained telemetry is emitted. In a mature otel pipeline, batching usually follows filtering, sampling, or transformation, because it is more economical to batch the smaller, higher-value payload set that remains after optimization.
The tail sampling processor is preferable when analytical value depends on outcomes that are only visible after a trace unfolds. Error status, latency thresholds, and other downstream evidence are common examples. The trade-off is operational: the collector must buffer trace state, and all spans for the same trace must reach the same decision point.
- Generate repeatable traces with otelgen or telemetrygen.
- Place one remote tap before the tail sampling processor and one after it.
- Inspect durations, status codes, or other policy criteria in both streams.
In our example in the article, traces above the latency threshold remain after sampling, which provides a practical validation of policy behaviour. This is more rigorous than relying only on backend dashboards, where multiple downstream factors can obscure the sampling decision.
- 4317 is commonly used for OTLP over gRPC.
- 4318 is commonly used for OTLP over HTTP, which is why searches for otel 4318 or opentelemetry collector ports are common.
- In the remote tap example, port 12001 is the default WebSocket endpoint for the first tap and 12002 is used for the second.
- For local testing, insecure OTLP flags may be acceptable, but production ingress and egress should normally use TLS.
Optimizing telemetry pipelines in Kubernetes is usually an exercise in selective retention and careful placement of control points. In Istio, this often means lowering random trace sampling percentages and restricting access logs. In broader Kubernetes environments, it also means trimming verbose payloads, merging repetitive events, routing low-value streams to cheaper destinations, and designing collector tiers that can safely support stateful processors.
- First classify telemetry by operational value.
- Then reduce low-value data through filtering, aggregation, sampling, or routing.
- Preserve incident-critical metrics, labels, or log classes explicitly rather than assuming they will survive optimization.
- Where deletion is unacceptable, route lower-value data to cheaper storage tiers instead of keeping it in the primary observability backend.
- Use adaptive policies only when there is an explicit mechanism for exemptions and review.
- Standardize telemetry semantics first, especially for multi-step agent workflows.
- Preserve end-to-end traces for tool invocation chains, retries, failures, and escalation paths.
- Track the metrics that matter operationally: latency, error rate, token or cost usage, queue depth, and action outcomes.
- Filter or aggregate verbose low-value events so that agentic SRE and agentic SecOps systems are not trained or triggered by noise.
- Keep audit-oriented logs for security-sensitive actions, because autonomous systems require explainability as well as performance data.
- Instrument code liberally with logs (AI and human) so that tools like Gonzo and Dstl8 can detect, resolve and improve using fast feedback loops.
Table of Contents
Logs. Understood. Instantly.
Analyze logs directly in your terminal with real-time insights and AI-powered pattern detection—no dashboards, no friction.
 Back
Backpress@controltheory.com