Introduction
Due to the high cost of ingesting/storing/indexing telemetry associated with many observability solution providers, we’ve noticed a trend across customers where they will restrict retention on their observability backend of choice (e.g., 2 weeks retention), but a broader set of telemetry over longer time periods is retained in object storage (or other “cold storage”) such as AWS S3. This most commonly is used in context of logs, since as one CTO recently put it, “almost 100% of logs go unread.” This pattern can also be leveraged for metrics and traces.
Once we’re sending a chunk of our telemetry to long term storage, it raises the next question, or how do I get it back or “rehydrate” this telemetry into our observability backend of choice?
In this blog, we’ll walk through how to send data to S3 in part I, and then how to rehydrate it in part II, utilizing the standard OpenTelemetry (OTel) collector.
Initial Setup
Let’s start with the setup we defined in a previous blog post. Recall that in that blog, we set up three “optimized” pipelines for our logs, metrics and traces. This leveraged various “processors” to focus on the key signals of interest and increase our signal to noise – and reduce our observability bill! Now, we’d like to store the “raw” telemetry in AWS S3. Maybe you have audit data or similar that you need to keep around, you want to baseline (or sample) “normal” behaviors, or keep this raw data around “just in case” – but you want to do this cost effectively, and be able to retrieve the data if you need to.
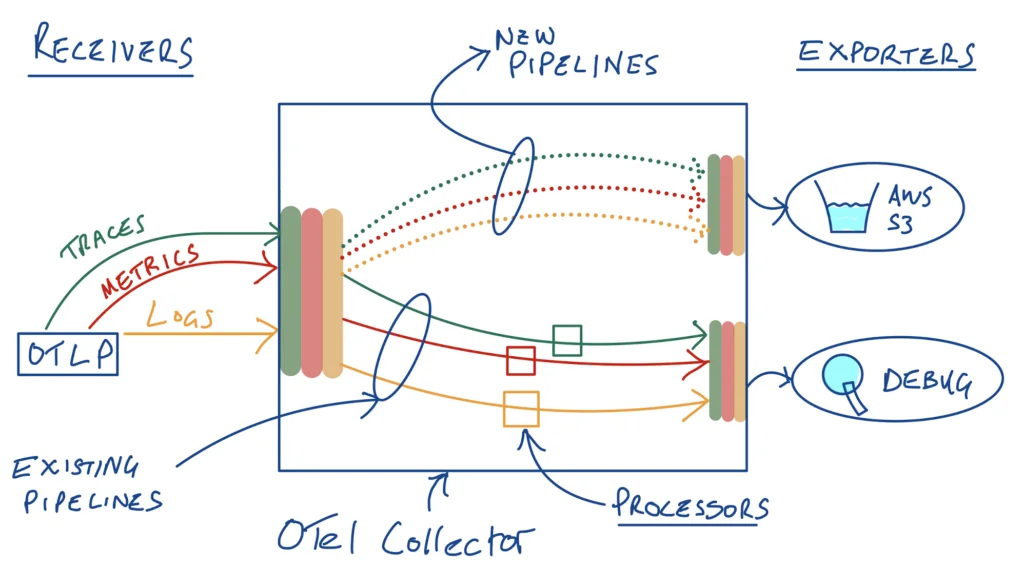
To do this, we’ll add 3 new pipelines – remember that we need a pipeline for each telemetry type, so if we want to send our raw logs, metrics and traces to an S3 destination, we’ll need 3 new pipelines, one for each telemetry type.
That results in 3 “optimized” pipelines going to our debug exporter/destination, and then we’ll add 3 more to send the “raw” telemetry to S3. An OTLP source/receiver serves as input for all telemetry types.
In with the old, in with the new!
So how do we actually send the telemetry to S3?
The AWS S3 Exporter
Enter the “AWS S3 exporter” – an exporter in the OTel contrib repo. This exporter takes our logs, metrics and traces flowing through the OTel collector, and supports sending the data to S3 in various formats. In this example, we’re going to send to S3 in the standard OLTP JSON format (the default). We need to provide an AWS region (”us-east-1” by default) and an S3 bucket name and optionally an s3_prefix (root directory/folder inside the bucket) and a file_prefix (prefix for the name of our S3 files). There are also various advanced options for things like compression as well as an s3_partition that dictates the granularity of the telemetry in our S3 key/ folder (”minute” by default). The exporter supports formatting the data sent to S3 in various formats – we’ll use the default of otlp_json.
The example OTel collector config snippet from Github:
exporters:
  awss3:
    s3uploader:
        region: 'eu-central-1'
        s3_bucket: 'databucket'
        s3_prefix: 'metric'
s3_partition: 'minute'We might choose to create multiple destinations/exporters to delineate between telemetry types for example, but we’re going to store all of our logs, metrics and traces in the same bucket (and folder) here.
Authentication
One option for credentials is to install the AWS CLI where you run the collector (we’ll be running the standard OTel collector as a Docker container here). Another option is to leverage Environment Variables – i.e. the AWS_ACCESS_KEY_ID and AWS_SECRET_ACCESS_KEY referenced in the Gihtub repo. We’ll inject these environment variables at runtime into our Docker container here, but you’ll want to use a secure setup for production such as Hashicorp Vault or similar if you go this path.
Our Config
Let’s put our 3 existing pipelines and the 3 new ones to S3 in our OTel collector config. For our AWS S3 exporter, we’re targeting a bucket called oteldatadump and we’ve added a generic telemetry prefix, with the default one minute granularity.
exporters:
  debug:
  awss3:
   s3uploader:
       region: 'us-east-1'
       s3_bucket: 'oteldatadump'
       s3_prefix: 'telemetry'
       s3_partition: 'minute'
processors:
    batch:
    filter/severity:
        logs:
            log_record:
                - severity_number < SEVERITY_NUMBER_WARN
    filter/userid:
        error_mode: ignore
        metrics:
            datapoint:
                - not ((IsMatch(attributes["user_id"], "^1")))
    logdedup:
        interval: 5s
        log_count_attribute: dedup_count
        timezone: America/Chicago
    tail_sampling:
        decision_wait: 10s
        num_traces: 100
        expected_new_traces_per_sec: 10
        decision_cache:
          sampled_cache_size: 100000
        policies:
          - name: test-policy-1
            type: latency
            latency:
              threshold_ms: 300
          - name: test-policy-2
            type: status_code
            status_code:
              status_codes:
                - ERROR
                - UNSET
receivers:
    otlp:
        protocols:
            grpc:
                endpoint: 0.0.0.0:4317
            http:
                endpoint: 0.0.0.0:4318
service:
    pipelines:
        logs:
            exporters:
                - debug
            processors:
                - filter/severity
                - logdedup
                - batch
            receivers:
                - otlp
        metrics:
            exporters:
                - debug
            processors:
                - filter/userid
                - batch
            receivers:
                - otlp
        traces:
            exporters:
                - debug
            processors:
                - tail_sampling
                - batch
            receivers:
                - otlp
        logs/objectstorage:
            exporters:
                - awss3
            processors:
                - batch
            receivers:
                - otlp
        metrics/objectstorage:
            exporters:
                - awss3
            processors:
                - batch
            receivers:
                - otlp
        traces/objectstorage:
            exporters:
                - awss3
            processors:
                - batch
            receivers:
- otlpRunning the Collector
Similar to our previous posts, we’ll run the standard OTel collector (OTel collector contrib) in a Docker container, loading the OTel collector config file above and exposing the OTLP receiver ports as well as injecting our AWS environment variables for auth to the S3 bucket:
docker run -v $(pwd)/config.yaml:/etc/otelcol-contrib/config.yaml -p 4317:4317 -p 4318:4318 -e AWS_ACCESS_KEY_ID=XXXXX -e AWS_SECRET_ACCESS_KEY=XXXXX otel/opentelemetry-collector-contrib:latestGenerating Telemetry
There’s a handy utility called “otelgen” that can be used to send logs, metrics and traces to the collector in OTLP format. For example, to send logs, metrics and traces using the Docker image to our (mac) localhost on port 4317:
Logs
docker run --rm ghcr.io/krzko/otelgen:latest --otel-exporter-otlp-endpoint host.docker.internal:4317 --insecure logs mMetrics (gauge option)
docker run --rm ghcr.io/krzko/otelgen:latest --otel-exporter-otlp-endpoint host.docker.internal:4317 --insecure metrics gTraces
docker run --rm ghcr.io/krzko/otelgen:latest --otel-exporter-otlp-endpoint host.docker.internal:4317 --insecure traces mPutting it Together
After running the collector with the configuration above and the appropriate environment variables and injecting telemetry, you should see something similar to the following in your S3 bucket (in the AWS console):
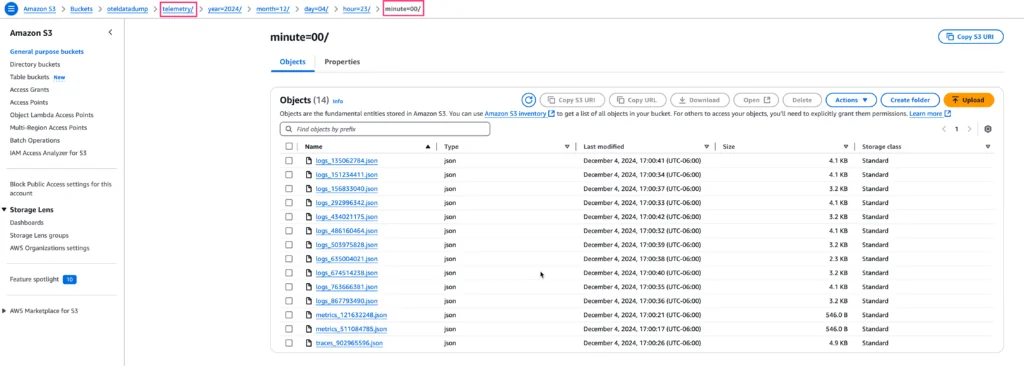
Filling the bucket!
We have minute granularity folders and our telemetry prefix at the root. The JSON files are also prefixed with the telemetry type, logs, traces etc.
Getting the Data Back a.k.a “Rehydration”
Now we have our telemetry data in S3, we need a way to get it back if we need to. In other words, we need a way to turn what was previously a destination (exporter) into a source (receiver). Fortunately, there’s a receiver for that called the “AWSs3receiver.” Looking at the readme, it looks fairly straightforward; we need to specify an S3 bucket and prefix like before, and a starttime and endtime (YYYY-MM-DD HH:MM) for the data we want to retrieve. Since the receiver understands otlp_json format by default (the format we used to send data to S3 above) – we won’t need to add any “extensions” for dealing with other encodings. We’ll also ignore the OpAmp notifications (more on that another time). Auth is required again to read from the S3 bucket and we can use the same environment variable approach we used earlier. We’ve put in a start and end time (~ 2hr duration) corresponding to where our data was stored in our S3 bucket above.
receivers:
  awss3:
    starttime: "2024-12-04 22:00"
    endtime: "2024-12-04 23:59"
    s3downloader:
        region: "us-east-1"
        s3_bucket: "oteldatadump"
        s3_prefix: "telemetry"
s3_partition: "minute"OTel Collector Config Snippet – AWSS3Receiver
More Pipelines!
So we’ve got the config for our new S3 source – but how are we going to wire it up? With more pipelines! Let’s create 3 new pipelines (one for each of our logs, metrics and traces telemetry types). We’ll send the data being read from S3 to the debug exporter again in this case – in practice, you’ll want to send this data to your observability backend(s) of choice. On a more serious note, this is a good example of how pipelines can grow, as you add more processing, sources and destinations to your configurations.
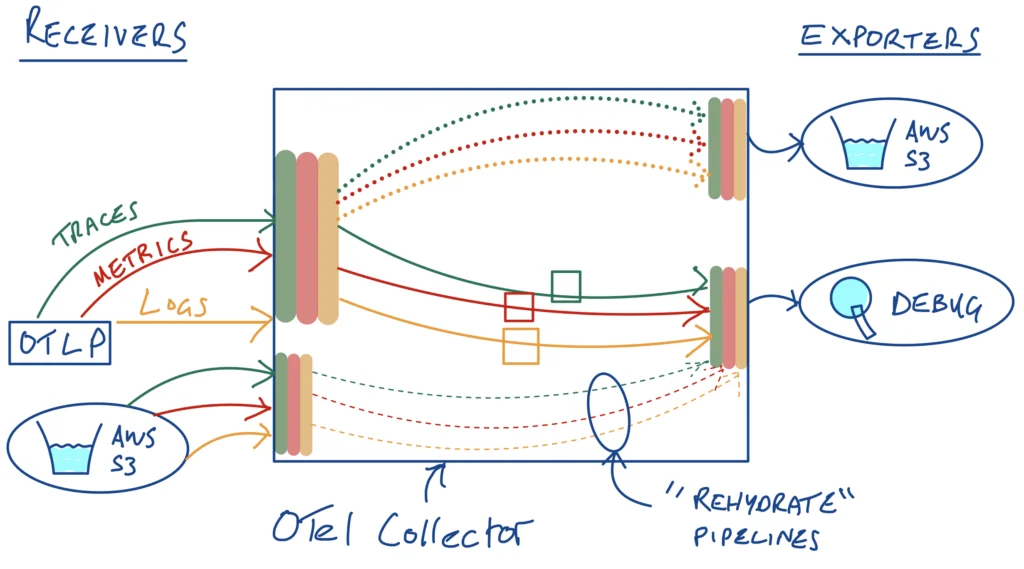
Pipelines, pipelines everywhere….
Putting it Together
So we can add out new receiver and pipelines to a new configuration file:
exporters:
debug:
awss3:
s3uploader:
region: 'us-east-1'
s3_bucket: 'oteldatadump'
s3_prefix: 'telemetry'
s3_partition: 'minute'
processors:
batch:
filter/severity:
logs:
log_record:
- severity_number < SEVERITY_NUMBER_WARN
filter/userid:
error_mode: ignore
metrics:
datapoint:
- not ((IsMatch(attributes["user_id"], "^1")))
logdedup:
interval: 5s
log_count_attribute: dedup_count
timezone: America/Chicago
tail_sampling:
decision_cache:
sampled_cache_size: 100000
decision_wait: 10s
expected_new_traces_per_sec: 10
num_traces: 100
policies:
- latency:
threshold_ms: 300
name: test-policy-1
type: latency
- name: test-policy-2
status_code:
status_codes:
- ERROR
- UNSET
type: status_code
receivers:
  awss3:
    starttime: "2024-12-04 22:00"
    endtime: "2024-12-04 23:59"
    s3downloader:
        region: "us-east-1"
        s3_bucket: "oteldatadump"
        s3_prefix: "telemetry"
        s3_partition: "minute"
otlp:
protocols:
grpc:
endpoint: 0.0.0.0:4317
http:
endpoint: 0.0.0.0:4318
service:
pipelines:
logs:
exporters:
- debug
processors:
- filter/severity
- logdedup
- batch
receivers:
- otlp
metrics:
exporters:
- debug
processors:
- filter/userid
- batch
receivers:
- otlp
traces:
exporters:
- debug
processors:
- tail_sampling
- batch
receivers:
- otlp
logs/objectstorage:
exporters:
- awss3
processors:
- batch
receivers:
- otlp
metrics/objectstorage:
exporters:
- awss3
processors:
- batch
receivers:
- otlp
traces/objectstorage:
exporters:
- awss3
processors:
- batch
receivers:
- otlp
logs/rehydrate:
exporters:
- debug
processors:
- batch
receivers:
- awss3
metrics/rehydrate:
exporters:
- debug
processors:
- batch
receivers:
- awss3
traces/rehydrate:
exporters:
- debug
processors:
- batch
receivers:
- awss3We can run this updated configuration file with Docker as before:
docker run -v $(pwd)/config.yaml:/etc/otelcol-contrib/config.yaml -p 4317:4317 -p 4318:4318 -e AWS_ACCESS_KEY_ID=XXXXX -e AWS_SECRET_ACCESS_KEY=XXXXX otel/opentelemetry-collector-contrib:latestIf everything is configured correctly, you should see the telemetry being read from S3 and output into your terminal similar to:
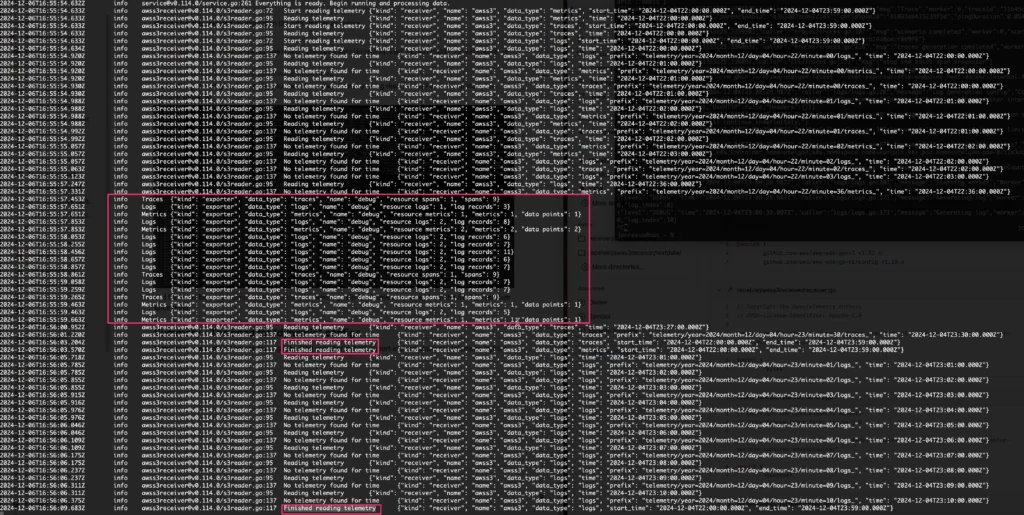
Debug Exporter Output from the terminal
and there will be a Finished reading telemetry message (for each telemetry type) from the AWS S3 receiver once done.
Summary – The need for “ephemeral” configs
In this blog, we explored how to leverage the OpenTelemetry (OTel) collector to both export and rehydrate our telemetry to/from AWS S3. As we optimize the telemetry going to our observability backends to reduce costs and improve insights, we can retain the “raw” telemetry in low cost storage (S3) and be confident that we can get it back if we need to (e.g., for compliance/audit or other drivers)
What this exercise exposes though, is the need to treat our OTel collector configurations as “ephemeral.” We needed to configure new pipelines to send data to S3, but also configure new ones to retrieve a desired (2 hour) window of data to send to our observability backend. Maybe this is a request from an auditor – and we need to turn it around quickly!
Imagine a world where development and engineering teams can instrument at will and as needed, without the fear of driving up observability bills. What if we could change our configurations (and pipelines) “at will”? – to “dial up” the telemetry we want when deploying a critical new release for example, or “dial in” our telemetry (via deploying a new config) to focus on a specific component during an incident?
In short – our collector configurations (and associated pipelines) need to be programmed and controlled at will, to meet business needs. This requires a separation of the “data plane” (where the telemetry data is flowing) and the “control plane” (how we intelligently configure it). That’s what we’re building here at ControlTheory – and if you’re interested in learning more, we’d love to talk to you!
Table of Contents
Logs. Understood. Instantly.
Analyze logs directly in your terminal with real-time insights and AI-powered pattern detection—no dashboards, no friction.
Get Gonzo Back
Backpress@controltheory.com