Distilling Observability: Find the Right Answers
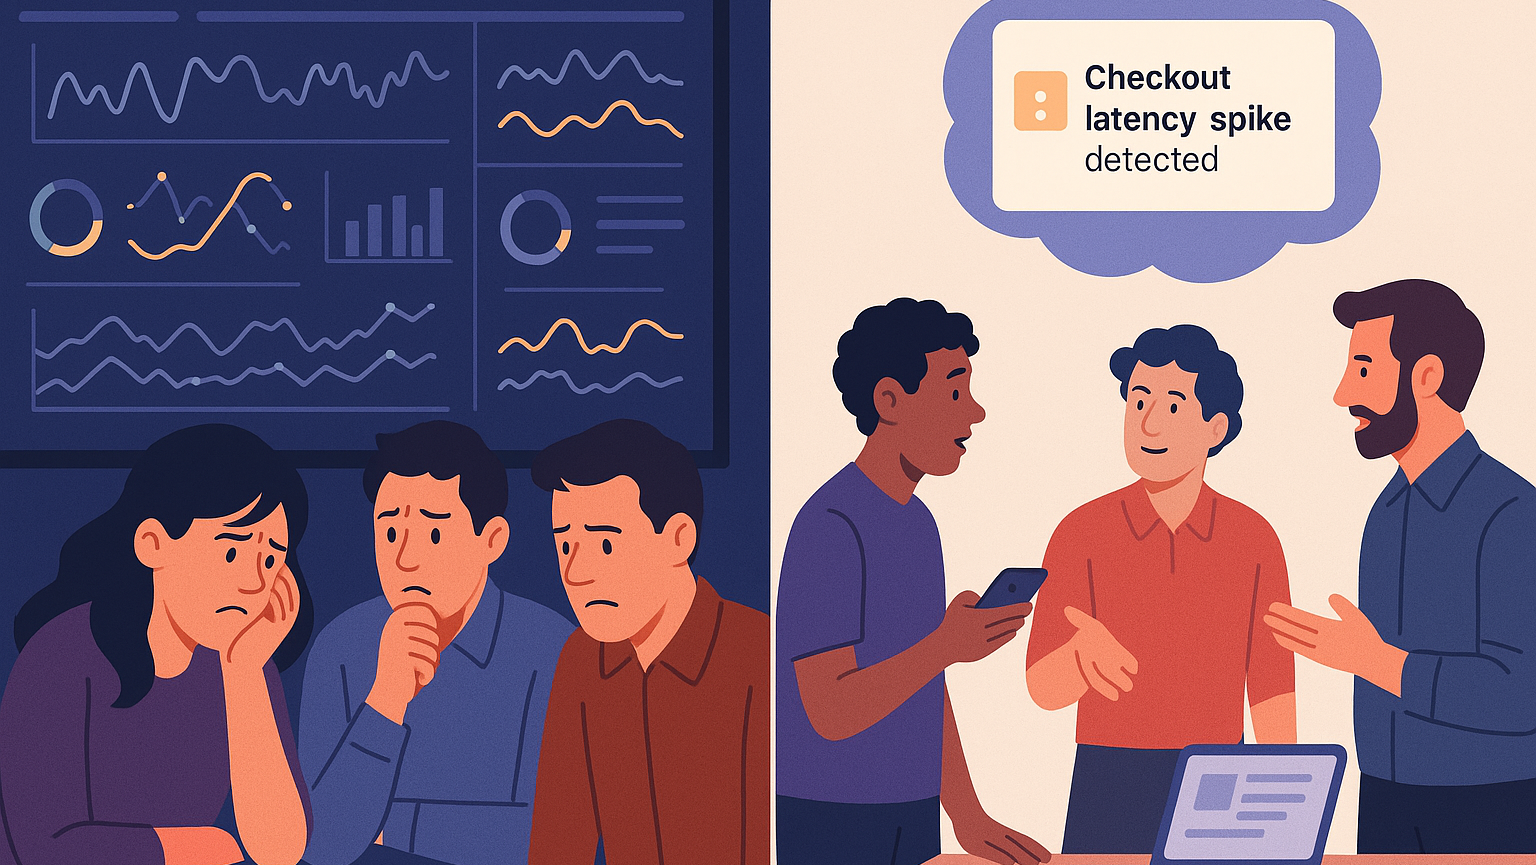
ControlTheory's "Distilling Observability" series explores how observability is evolving from raw data capture to continuous, intelligent understanding. Part 2 of the series looks at how you can use Gonzo to make your logs talk to you - see here for Part 1.If you’ve ever been on call for a Kubernetes cluster at 2 AM, you know the feeling. Alerts are red across CloudWatch and Datadog. Dashboards show elevated error rates, but they don’t tell you why. You drop into kubectl logs, start grepping for clues, and 30 minutes later, you’re still guessing.
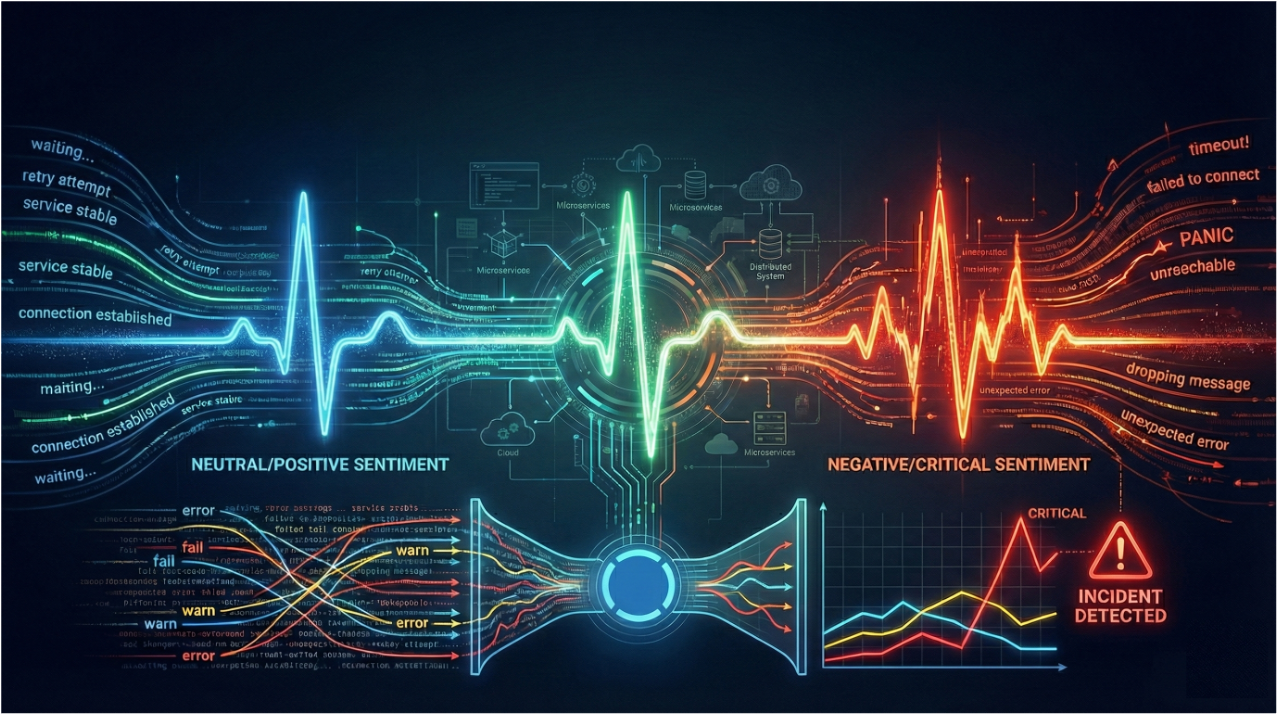
That’s the state of observability today. We have more data than ever, but less time and clarity to make sense of it. Metrics show symptoms. Traces show paths. But logs still hold the truth if you can find it in time.
This is where Gonzo comes in. Gonzo is an open-source terminal UI that brings distillation and AI-powered insight to your logs, right where you work. It’s not another dashboard. It’s your log companion: real-time, OTLP-native, and built for engineers who want answers, not just data.
In this post, we’ll expand on the Fintech use-case introduced in Part 1, a regional bank’s credit-risk platform and show how Gonzo helps you find answers faster. You’ll see how Gonzo doesn’t just visualize logs, it makes them talk back. Logs are the diary of your systems, filled with characters (services), settings (deployments), and conflict (errors). Gonzo helps you uncover the plot and often the smoking gun that ties the whole story together, all without writing a single query.
The Observability Insight Gap
- Data-rich, insight-poor – Dashboards tell you what is wrong (e.g., high latency, error spikes) but rarely why.
- Query language barrier – You know there’s a pattern hiding in there (assuming you haven’t already dropped those logs to keep Finance happy). Even then, crafting the perfect filter or query in AWS CloudWatch or Datadog eats time and brain cycles.
- Manual correlation – You’re copying timestamps between systems, chasing threads across Kafka, RDS, and APIs.
- Shadow AI workarounds – Engineers are already pasting logs into ChatGPT for help, because they need an explanation, not a wall of JSON.
The gap isn’t in the data; it’s in the interpretation. We’ve mastered collection, so what we need next is comprehension. The goal is to converse with your application and infrastructure telemetry in real time.
Logs as Language
Logs are the diary of your systems; timestamped sentences that tell stories of deployments, retries, and failures. Traditional tools treat them as records and line items, whereas Gonzo treats them as language.
By utilizing natural language processing and clustering, Gonzo identifies patterns, frequencies, and anomalies in real time. It groups similar messages, highlights unusual ones, and even summarizes them in plain English using AI.
That’s what we mean by distillation over just enabling mass collection for aggregation. Instead of trying to control the flood of telemetry, we distill what matters from it to eliminate the noise.
The Fintech Incident: Credit Risk Platform
Our use-case comes from a mid-sized regional bank running a credit-risk scoring platform on Amazon EKS.
- Tech Stack – Python-based scoring microservices, Kafka for message queues, RDS for persistence, and an API gateway front end.
- Deployment Context – During a rollout of score-service v2.3.1, the team noticed Kafka lag spikes, timeout errors, and customer-facing 500s.
- Goal – Identify root cause before customer impact spreads.
Below is a snippet from their fintech-incident.log, captured during the event.
{"time": "2025-10-31T14:00:05Z", "severity": "INFO", "body": "score-service version 2.3 starting up", "attributes": {"service.name": "score-service", "version": "2.3.0", "env": "prod"}}
{"time": "2025-10-31T14:03:00Z", "severity": "WARN", "body": "Kafka consumer lag high", "attributes": {"service.name": "score-service", "lag": 1200}}
{"time": "2025-10-31T14:03:10Z", "severity": "ERROR", "body": "Database connection lost, retrying", "attributes": {"service.name": "score-service", "db.instance": "financedb", "error.code": "DB-CONN-ERROR"}}
{"time": "2025-10-31T14:03:15Z", "severity": "ERROR", "body": "OutOfMemoryError: Java heap space", "attributes": {"service.name": "score-service", "error.type": "OutOfMemoryError"}}
2025-10-31 14:03:16 LegacySystem: Error Code 131 - transaction aborted for user USER-12345
{"time": "2025-10-31T14:03:18Z", "severity": "ERROR", "body": "Timeout calling score-service for application", "attributes": {"service.name": "api-gateway", "application.id": "APP-98765", "user.id": "USER-12345", "error.type": "TimeoutError"}}
{"time": "2025-10-31T14:03:30Z", "severity": "INFO", "body": "score-service restarted after crash", "attributes": {"service.name": "score-service", "uptime": 15}}
{"time": "2025-10-31T14:03:40Z", "severity": "INFO", "body": "Kafka consumer lag back to normal", "attributes": {"service.name": "score-service", "lag": 30}}At a glance, this looks like chaos, filled with mixed severities, multiple services, and different formats. But Gonzo sees structure in it.
Running Gonzo
Simply run Gonzo to ingest locally or connect it to live OTLP streams. To analyze the sample incident log, use:
brew install gonzo
export OPENAI_API_KEY="sk-<your-key-here>"

gonzo -f fintech-incident.log --ai-model="gpt-4"Alternatively, to leverage a local model with Ollama:
export OPENAI_API_KEY="ollama"
export OPENAI_API_BASE="http://localhost:11434"
gonzo -f fintech-incident.logWhat You’ll See
Once launched, Gonzo opens an interactive terminal UI (similar to k9s):
- Word Frequency Panel – highlights dominant terms like “Kafka,” “lag,” “Error,” and “connection.”
- Top Attributes Panel – shows key fields from structured logs, such as service.name, user.id, and db.instance.
- Patterns Panel – clusters similar logs together (“Kafka consumer lag high” or “Processed credit score for application”).
- Counts Panel – displays a timeline of log volumes by severity, revealing when WARNs and ERRORs spiked.
- Log Feed – streams color-coded entries in real time (INFO green, WARN yellow, ERROR red).
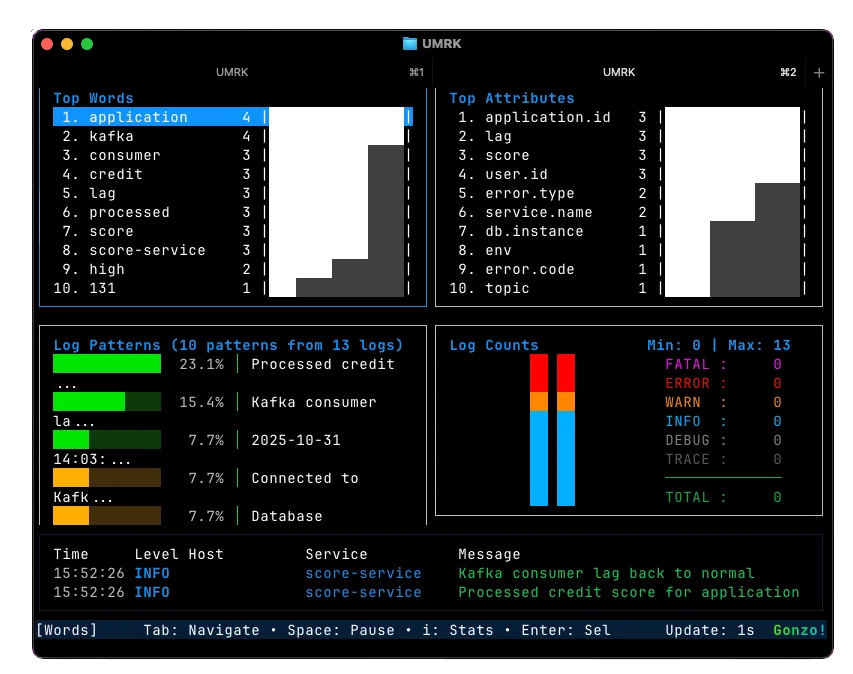
Within seconds, you can spot the problem window and see in the log counts that WARN and ERROR events start to prominently appear. The Kafka lag climbs, the database connection drops, and memory exhaustion follows.
Instead of depending on aggregation and filtering to find correlation, we shift to distillation. The engine behind Gonzo surfaces the correlative events so that you can focus on getting to causation.
Distillation in Action
Here’s what Gonzo surfaces without any queries or filters:
- Patterns:
- Kafka consumer lag high (2 occurrences)
- Database connection lost, retrying (1 occurrence)
- OutOfMemoryError: Java heap space (1 occurrence)
- Timeout calling score-service for application (1 occurrence)
- Top Attributes:
- service.name = score-service (dominant error source)
- service.name = api-gateway (secondary, downstream impact)
- user.id = USER-12345 (frequent across multiple failures)
- Timeline:
- WARN and ERROR spike at 14:03 → service restart → recovery by 14:04.
Without scrolling through hundreds of lines, Gonzo has distilled the story for you: score-service v2.3.1 crashed due to database timeouts and memory exhaustion, causing API timeouts downstream.
We get to causation without you having to become a graph query guru in your logging tools.
Conversational Logs: Press i for Insight
Now comes the fun part! Gonzo’s AI insight mode.
Highlight a log line (e.g., the OutOfMemoryError) and press i. Gonzo sends the log context to your configured AI model (a hosted model like GPT-4 or a local LLM via Ollama or LM Studio). In seconds, you get a human-readable explanation, for example:
“The OutOfMemoryError likely occurred after the database connection loss, which caused retries to accumulate messages in Kafka. The growing queue increased memory pressure in the scoring service, resulting in a crash. This aligns with the WARN and ERROR sequence at 14:03.”
Instead of correlation by hand, you get a hypothesis: a plain-language explanation generated directly from your logs.
Gonzo never filters, forwards, or alters your log flow. It’s a read-only receiver. You can continue shipping logs to your existing observability platforms while Gonzo provides fast, local pattern recognition and AI summaries.
From Data to Decisions
In under a minute, Gonzo distilled a noisy incident into an actionable narrative:
- What happened: Kafka lag rose, DB connections failed, service ran out of memory.
- Who was affected: API requests involving USER-12345.
- Why: The new deployment caused retries and queue buildup.
- Resolution: Automatic restart cleared the backlog.
That’s the difference between collecting observability data and controlling it.
What’s Next
We’ve shown how Gonzo helps you surface insights (Part 1) and find answers (this post). In Part 3, we’ll explore what happens with distillation as we expand the use-cases further. It’s where we move from local insight to systemic control and yes, there’s one more thing we’re adding to the mix.
Try Gonzo Today
You can install Gonzo right now and feed it your own logs:
brew install gonzo
kubectl logs -f deployment/score-service | gonzoTo enable AI insights:
export OPENAI_API_KEY="sk-<your-key>"
gonzo --ai-model=gpt-4Or connect to a local LLM like Ollama or LM Studio for offline analysis.
Distill, don’t drown. Find the right answers with Gonzo.
 Back
Backpress@controltheory.com