

In our conversations with customers, one thing has become clear – that distributed traces are an extremely (and perhaps the most) powerful signal for both detecting and resolving production issues, as well as for measuring the overall customer experience. Despite their potential though, we find many customers being held back by their current observability provider’s tracing implementation – the inability to affordably store (and analyze) all of those traces leads to sampling strategies that are not working for customers, and holding back them from their true potential – and many are looking to OpenTelemetry tail sampling with the “tail sampling processor” in the OTel collector as one potential solution.
Traces – The Power, Potential and Pitfalls
A few years ago, I stumbled across an article by Cindy Sridharan called “Distributed Tracing – we’ve been doing it wrong”. which really opened my eyes to the potential of modern distributed tracing in Kubernetes and microservices based environments, some of the pitfalls, and ideas for moving forward (p.s. most are still relevant 🙂). Originally coming out of places like Google, Twitter and Uber, traces have continued to evolve – eventually producing the OpenTelemetry project itself through the merger of OpenCensus and OpenTracing.
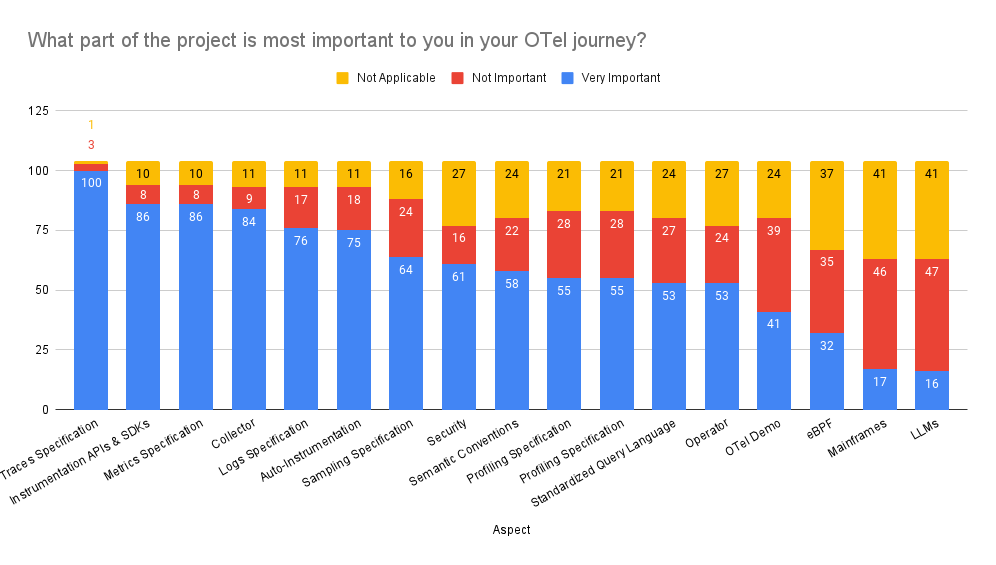
While tracing adoption has historically lagged that of logs and metrics, the recent OpenTelemetry Getting Started Survey indicated a very strong interest in the Traces specification and strong alignment with Kubernetes and Docker.

From OpenTelemetry Getting Started Survey
For those who are leveraging traces today in their code though, we hear consistently that they are not content with the trace sampling strategies supported by their vendors.
Why Sampling?
So why sample traces at all? In short – because of cost. It’s simply not cost effective for the majority of customers we’ve spoken to, to ingest, store and index all of their emitted traces in their current observability vendor. There is also a “signal to noise” driver here – if we have a way to track, retain and analyze the important or “high signal” traces, we can proactively point our engineering and dev teams at those traces, without them having to filter through a bunch of noise, potentially reducing our mean time to identify (MTTI) and restore (MTTR) service issues.
When Not to Use OpenTelemetry Sampling
There are certainly cases though where we might not want to sample. Consider a recent conversation with a customer who wanted to retain all of their traces across releases, so that they could analyze the customer experience (latency) across those releases (via regression analysis) to understand if things are getting better (or worse) for customers. Sending a copy of all traces to AWS S3 was one option they were exploring for their data analytics team to perform such analyses.
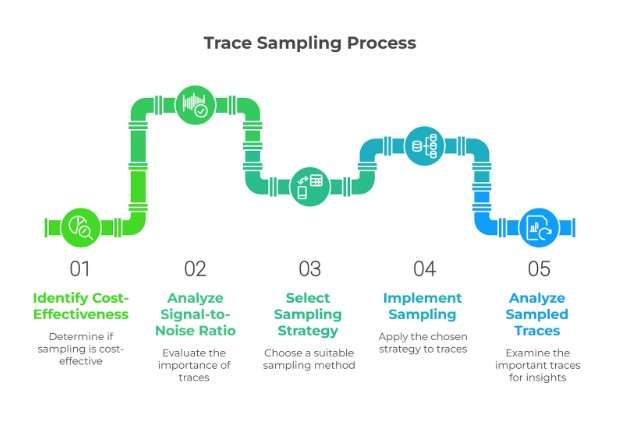
Once we’ve decided to sample our traces though, what are our options? Let’s recap some of the most common sampling strategies in use.
Types of Sampling
These are some of the most common trace sampling options in use today:
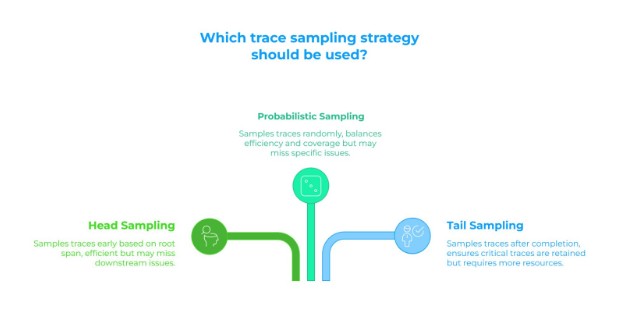
Head Sampling
Head sampling is a sampling strategy to make a decision of whether to keep a trace as early as possible (usually based on the root span) without understanding what could happen in the trace “downstream”, often supported in the tracing SDK for a given language e.g. for Go in OpenTelemetry, or Head sampling with the DataDog agent. Head sampling can be programmed to target traces of a given type up front (e.g. certain services), or it can be combined with other strategies like probabilistic sampling (up next).
Probabilistic Sampling
Probabilistic sampling is basically how it sounds – we roll the dice to decide whether to keep a trace (or span) around. For example, there is a processor available for the OTel collector (in contrib) called the “Probabilistic Sampling Processor” that can sample trace spans (and logs too). Probablistic sampling can be combined with Head Sampling – for example we may define a policy where we want to sample 1% of complete traces based on a decision up front / at the head.
Tail Sampling
With tail sampling, the decision of whether to retain a trace is made after the trace has completed (or at least after some “significant” time has passed – for example 30 seconds is the default for the OTel collector Tail Sampling Processor). As you can probably already tell, there are a lot of trade offs between these techniques, not least of which is the performance and scaling requirements, for example of storing all of these traces (and their spans) in memory over the configured time window.
Many of the customers we talk to who express frustration with their current tracing implementation are using some type of Head and/or probabilistic sampling. The big issue here is that when an issue in production does occur – let’s say there’s a trace with “high” latency or with ERRORs in it, the engineering or dev team look to examine that trace in their observability tooling, only to find that it has “been thrown away”. As expressed in a recent conversation, “we’re just not getting the value out of the tracing module relative to what we’re paying for it”.
Most of these customers are looking to Tail Sampling as a solution, and the OTel collector provides a convenient way to implement it. Furthermore, customers can leverage this capability even if they have their code instrumented with a given vendors proprietary tracing libraries – since the OTel collector can typically translate these traces into OTLP format, perform tail sampling on the traces, and send them back to that same vendor. That is, we don’t have to undergo a lengthy re-instrumentation of our code to get these benefits.
Configuring the OpenTelemetry Tail Sampling Processor
The OTel Collector Tail Sampling Processor can be found in contrib here , and by my count has no less than 13 different sampling policies that can be configured (I’m counting the and and composite policies 🙂) Another one of those policies is the ottl_condition (OTTL = OpenTelemetry Transformation Language) policy which operates off of the span and span event properties, so you can see there’s a lot of possible policy combinations here!
In fact, this single processor alone has yielded dedicated tooling (e.g. OTail) to help configure it.
Let’s take a look at configuring the OTel collector to implement those two most commonly requested policies – traces with high latency or with ERRORs in them.
We’re going to use the following OTel collector config:
exporters:
  debug:
processors:
    remotetap/start:
        endpoint: 0.0.0.0:12001
    remotetap/end:
        endpoint: 0.0.0.0:12002
    batch:
    tail_sampling:
        decision_wait: 10s
        num_traces: 100
        expected_new_traces_per_sec: 10
        decision_cache:
          sampled_cache_size: 100000
        policies:
          - name: latency_policy
            type: latency
            latency:
              threshold_ms: 200
          - name: error_policy
            type: status_code
            status_code:
              status_codes:
                - ERROR
receivers:
    otlp:
        protocols:
            grpc:
                endpoint: 0.0.0.0:4317
            http:
                endpoint: 0.0.0.0:4318
service:
    pipelines:
        traces:
            exporters:
                - debug
            processors:
                - remotetap/start
                - tail_sampling
                - batch
                - remotetap/end
            receivers:
- otlpWe have a simple collector configuration that is receiving traffic via an OTLP receiver and sending it to a debugexporter. We can see the tail sampling processor is configured with two policies – one to sample traces when the trace latency exceeds 200ms and one to sample traces with a status code of ERROR. We have one pipeline configured for traces, and we’ve leveraged a trick from a previous blog post to use the Remote Tap processor at the start and the end of that pipeline.
We can run our contrib collector in a Docker container like follows (OTel collector contrib), being sure to expose the ports for (ingesting) OTLP and for both Remote Tap processors (websockets):
docker run -v $(pwd)/configtail.yaml:/etc/otelcol-contrib/config.yaml -p 4317:4317 -p 4318:4318 -p 12001:12001 -p 12002:12002 otel/opentelemetry-collector-contrib:0.117.0In the previous blog, we validated that the tail sampling processor was correctly sampling traces based on their latency – our first policy. Let’s do something similar here to make sure the processor is only sampling traces whose status code is set to ERROR. One way to validate this is to only run the error_policy tail sampling policy above in isolation, either by commenting out the latency policy, or by setting the latency to a very high value.
We can then generate our traces using otlegen like follows, to direct (1000) OTLP traces to localhost on our Mac collector container:
docker run --rm ghcr.io/krzko/otelgen:latest --otel-exporter-otlp-endpoint host.docker.internal:4317 --insecure traces m -t 1000 -s web_requestWe can use websocat to tap the websocket at the start and end of our traces pipeline respectively websocat ws://127.0.0.1:12001 for the start, and websocat ws://127.0.0.1:12002 for the end.
We see that the spans being generated have a status code of UNSET which basically means there are no ERRORS and therefore no traces are being sent out of our pipeline as we would expect (you can also try adding an additional status code of UNSET to the error_policy and you should then start to see spans and traces flow out of the pipeline again)
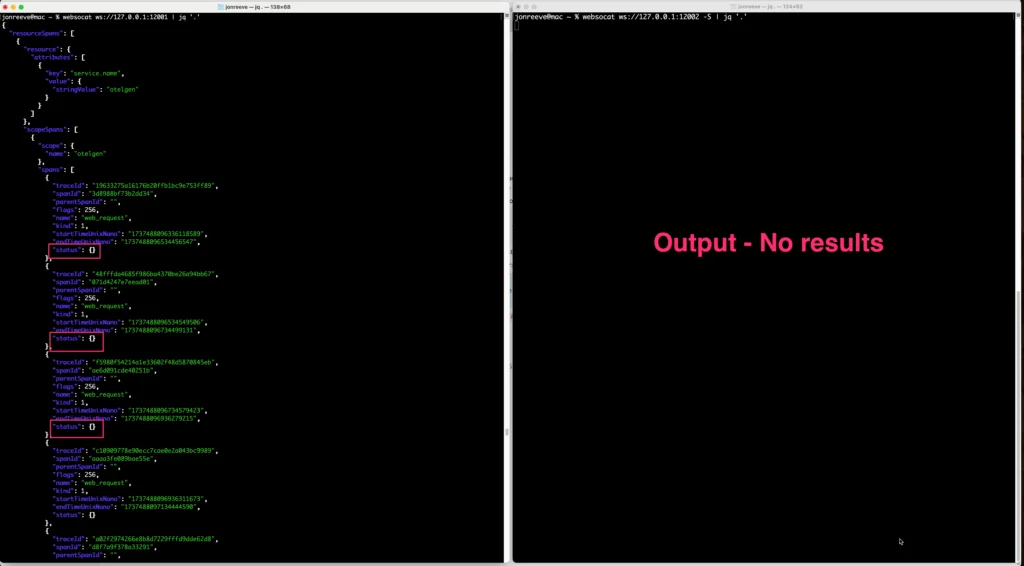
Traces pipeline with Tail Sampling input (left) and output (right) – spans with status of “unset” don’t make it through the pipeline since we are only looking for ERRORs
Kubernetes (& microservices) – Additional OpenTelemetry Tail Sampling Considerations
In the Tail Sampling Processor readme, we note that “All spans for a given trace MUST be received by the same collector instance for effective sampling decisions”. Consider a typical Kubernetes cluster where we may have microservices distributed across a set of pods running on different nodes in the cluster. Since a trace may span across multiple pods (and likely nodes), how do you ensure spans for a specific trace (ID) from the different pods end up at the same collector instance? This is fine if we have a single “gateway” collector that all the spans are being sent to, but tail sampling can be resource intensive and we may need a way to scale out across multiple tail sampling collectors.
The 2-Layer Opentelemetry Collector Configuration
In this case, the docs recommend a “two layer” setup, where the first layer handles load balancing (based on trace ID) to a second layer of collectors that actually do the tail sampling. The first layer can also be an OTel collector running the “load balancing exporter” – an exporter that can use the Trace ID (by default for traces) as a routing key to send traces consistently to a set of backends – in this case the 2nd layer of collectors that perform the tail sampling.
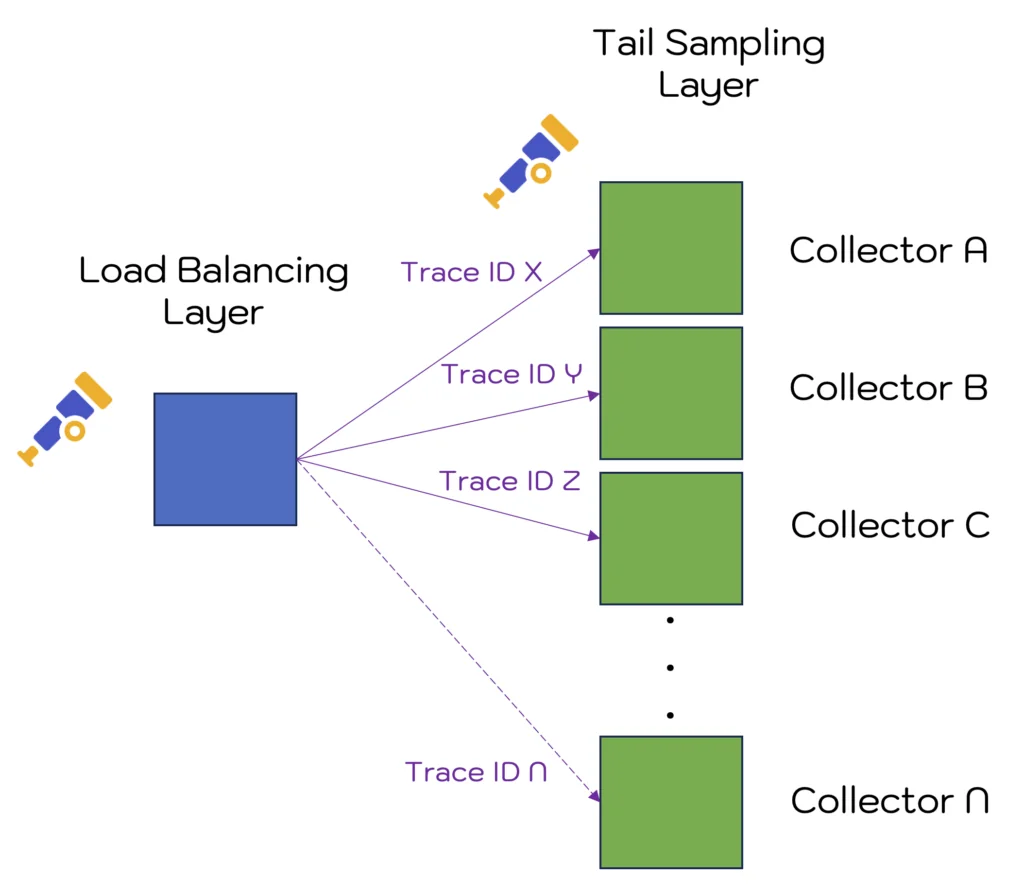
“Two Layer” OpenTelemetry Tail Sampling Configuration
Many folks already have the OTel collector deployed onto their Kubernetes clusters using the daemonset mode where a collector is run on each node in the cluster, and can also configure the load balancing exporter in those configurations. This topic deserves its own blog – stay tuned!
Summary
We talk to a lot of customers that are not seeing the value out of their current tracing implementations and observability vendors. Many are looking to OpenTelemetry tail sampling as one solution, and we’ve seen how the OTel collector can be set up with a processor to perform said tail sampling. This can help customers get better insight (and outcomes) out of the traces they are already generating, without having to rip and replace their current observability provider.
FAQs – Opentelemetry Tail Sampling
OpenTelemetry sampling is the deliberate reduction of collected trace volume so that distributed tracing remains operationally and financially sustainable. In practice, this means selecting traces in a way that preserves evidence of failures and performance anomalies while controlling ingest overhead.
In OpenTelemetry distributed tracing, sampling is typically applied to preserve diagnostic utility while reducing volume. Effective sampling prioritizes traces with error or latency signals, because these are disproportionally relevant for incident analysis.
- Tail based sampling makes retention decisions after a trace has accumulated sufficient span evidence, not at the start.
- In the OpenTelemetry Collector, tail sampling is implemented via the tail sampling processor with explicit policies.
- This enables policies such as “retain traces with ERROR” and “retain traces above latency threshold.”
- The tradeoff is state: the collector must hold traces in memory until the decision window closes.
In OpenTelemetry, a sampling rate is a quantitative target for how many traces you intend to retain relative to total traffic. The documentation notes that high-volume systems often achieve representativeness with low percentages, and deterministic head sampling can implement a consistent rate by using the trace ID and a configured percentage to decide which complete traces to keep.
The tail sampling processor buffers trace state and then decides after a configured waiting period.
decision_waitdefines how long the processor waits after the first span before deciding; defaults are commonly on the order of tens of seconds.num_tracesbounds how many traces are held in memory while awaiting decisions.expected_new_traces_per_secinforms internal allocation sizing for trace tracking structures.
These parameters should be set with explicit awareness of traffic rate, span fan-out, and memory ceilings.
The otel load balancing exporter is used to preserve trace affinity by routing spans according to trace identity, which is a prerequisite for correct tail-based sampling at scale. In practice, it enables a two-layer topology where one tier performs deterministic routing and the downstream tier performs stateful tail sampling.
- Use Remote Tap processors to observe telemetry at defined points in the pipeline (e.g., “start” vs “end”).
- Generate a controlled set of test traces and compare what enters the pipeline to what exits after tail sampling.
- If the sampling policy targets ERROR traces, spans with status UNSET should be filtered out as expected.
This approach yields empirically grounded validation without relying on backend UI interpretation.
Otelgen is a trace generator that can emit OTLP traffic and therefore enables repeatable OpenTelemetry examples for validating sampling policies. When combined with pipeline observation, it supports systematic testing of tail sampling rules without the confounding variability of production workloads.
- The trace ID identifies the trace that a span belongs to, enabling cross-service correlation.
- When Service A calls Service B, context propagation carries the trace ID and span ID so Service B can create a child span in the same trace.
- Trace IDs make it feasible to reconstruct a request path even when spans originate from different services and hosts.
- Deterministic head sampling may use the trace ID as an input to maintain consistent decisions.
Probabilistic sampling selects spans (and, depending on configuration, logs) according to a probability function—often derived from the TraceID — without waiting for the full trace to complete. Tail sampling, by contrast, delays the decision so that policies can depend on outcomes such as errors or end-to-end latency, which necessitates buffering and state.
ControlTheory can support OpenTelemetry tail-based sampling work in several adjacent (and non-duplicative) areas that typically determine whether tail sampling is operationally correct and sustainable in production:
- Policy enforcement and fleet-level control
The Intelligent Telemetry Control is positioned as a control-plane/data-plane approach for managing OpenTelemetry Collector fleets and enforcing telemetry usage controls (including sampling-oriented controls) consistently across environments.
- Architectures that preserve trace integrity at scale
Tail sampling is sensitive to deployment topology because the decision logic depends on coherent trace data. Our article OpenTelemetry Collector Deployment Patterns: A Guide discusses common Collector deployment models and the operational trade-offs (latency, resilience, manageability) that become decisive when tail-based sampling is introduced.
- Empirical validation of “input vs output” behavior in Collector pipelines
A recurring operational gap is the inability to observe what the Collector is actually receiving and emitting. Our article How to Validate & Optimize Telemetry with the OpenTelemetry Remote Tap Processor (and the Remote Tap Processor video) outlines a method for sampling pipeline traffic for inspection—useful for verifying that tail-sampling policies retain the intended trace populations.
- Preconditions for effective tail policies: enrichment and normalization
Tail-sampling policies are only as good as the attributes they can evaluate. The overview What Is the OpenTelemetry Transform Processor? explains how OTTL-based transformation can be used to enrich, normalize, and reduce noise in telemetry streams—often a prerequisite for robust, reproducible sampling policies.
- Repeatable test data for sampling experiments
For controlled evaluation of tail sampling (rather than inference from production drift), the how-to: How to use telemetrygen to feed Telemetry to the OTel Collector and our article: Otelgen with Docker – Simulate Telemetry for the OTel Collector provide a practical route to generating traces and stress-testing Collector configurations and policies.
Table of Contents
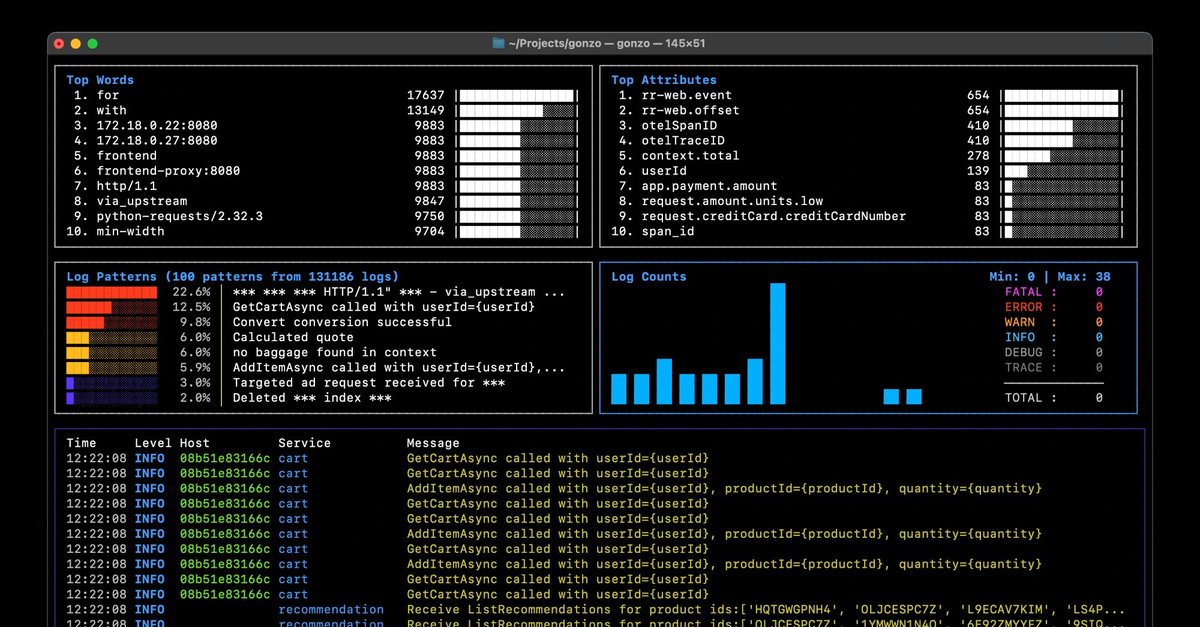
Logs. Understood. Instantly.
Analyze logs directly in your terminal with real-time insights and AI-powered pattern detection—no dashboards, no friction.
Get Gonzo Back
Backpress@controltheory.com