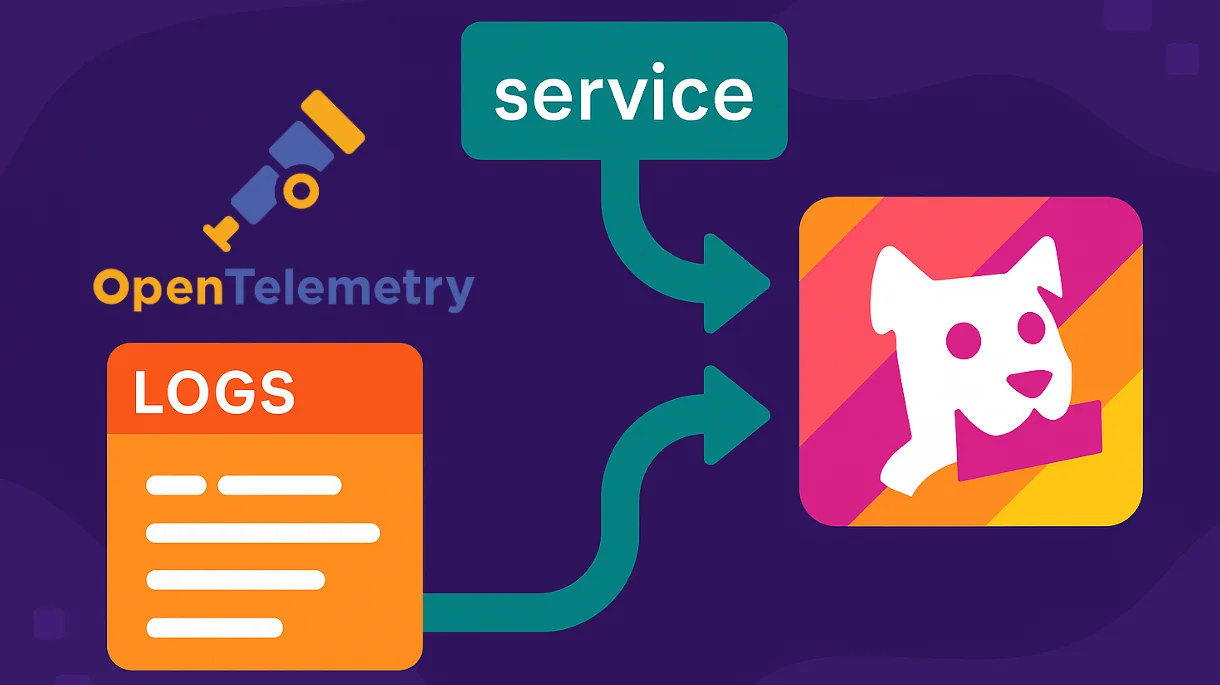
When sending logs from Kubernetes to Datadog using the OpenTelemetry (OTel) Collector, one critical detail often gets overlooked: correctly populating the service field. This field is essential for Datadog’s Unified Service Tagging, which powers service-level filtering, dashboards, and correlation across logs, traces, and metrics.
If you’re deploying the OTel Collector with a filelog receiver in Kubernetes as a daemonset, and forwarding logs to Datadog, this guide walks you through how to set the correct service tag using OpenTelemetry processors — ensuring that logs are properly grouped and searchable in Datadog.
The Problem: Default Service Naming
When logs are collected without an explicit service tag, Datadog attempts to infer one. In many Kubernetes environments, this defaults to the container image short name — especially when no Autodiscovery logs configuration is present. While this behavior is convenient, relying on it implicitly can lead to inconsistencies or unexpected service names.
When using the OpenTelemetry Collector, however, we have full control over how that service field is set — and we can replicate (or improve upon) the defaults that Datadog uses internally. Replicating the behavior can be useful if you are moving to the OTel collector to collect logs vs the Datadog agent.
Goal: Automatically Set service.name based on (Short) Container Image Name
We want to configure the OTel Collector to:
- Extract the container image name from Kubernetes metadata.
- Parse out the image short name (e.g.,
my-apifromgcr.io/my-org/my-api:latest). - Assign this value to
service.name. - Let the Datadog exporter remap
service.nametoservicewhen sending logs.
Step-by-Step Configuration
Firstly, let’s assume you are leveraging the OTel collector, deployed as a Daemonset on your K8s cluster, using the filelog receiver with a configuration similar to:
filelog:
  include:
    - /var/log/pods/*/*/*.log
  exclude:
    # Exclude logs from all containers named otel-collector
    - /var/log/pods/*/otel-collector/*.log
  start_at: end
  include_file_path: true
  include_file_name: false
  operators:
    # parse container logs
    - type: container
      id: container-parser
The container parser operator ensures you can parse container logs correctly regardless of container runtime (Docker, cri-o, Containerd)
Step 1: Use the Kubernetes Attributes Processor
First, ensure the k8sattributes processor is enriching logs with container metadata, specifically including container.image.name to grab the full container image name
k8sattributes:
  auth_type: serviceAccount
  filter:
    node_from_env_var: K8S_NODE_NAME
  extract:
    metadata:
      - k8s.namespace.name
      - k8s.pod.name
      - k8s.pod.uid
      - k8s.node.name
      - k8s.pod.start_time
      - k8s.deployment.name
      - k8s.replicaset.name
      - k8s.replicaset.uid
      - k8s.daemonset.name
      - k8s.daemonset.uid
      - k8s.job.name
      - k8s.job.uid
      - k8s.container.name
      - k8s.cronjob.name
      - k8s.statefulset.name
      - k8s.statefulset.uid
      - container.image.tag
      - container.image.name
      - k8s.cluster.uid
    labels:
      - tag_name: service.name
        key: app.kubernetes.io/name
        from: pod
      - tag_name: service.name
        key: k8s-app
        from: pod
      - tag_name: k8s.app.instance
        key: app.kubernetes.io/instance
        from: pod
      - tag_name: service.version
        key: app.kubernetes.io/version
        from: pod
      - tag_name: k8s.app.component
        key: app.kubernetes.io/component
        from: pod
  passthrough: false
  pod_association:
    - sources:
        - from: resource_attribute
          name: k8s.pod.uid
    - sources:
        - from: resource_attribute
          name: k8s.pod.name
        - from: resource_attribute
          name: k8s.namespace.name
        - from: resource_attribute
          name: k8s.node.name
    - sources:
        - from: resource_attribute
          name: k8s.pod.ip
    - sources:
        - from: resource_attribute
          name: k8s.pod.name
        - from: resource_attribute
          name: k8s.namespace.name
    - sources:
        - from: connection
This will add container.image.name (and other metadata) to the resource attributes for each log record.
Step 2: Extract the Short Image Name
Use the resource processor to extract the short image name using a regular expression (the resource processor is similar to the attributes processor but operates on resource attributes vs regular attibutes):
processors:
  resource:
    attributes:
      - key: container.image.name
        pattern: ^.*/(?P<short_image_name>[^@:]+)
        action: extract
This sets a new attribute short_image_name that contains just the final part of the image path — for example, my-app from gcr.io/org/my-app:latest.
Step 3: Set service.name to the Extracted Short Name
Now use the transform processor to assign short_image_name to the service.name field:
processors:
  transform:
    log_statements:
      - context: resource
        statements:
          - set(attributes["service.name"], attributes["short_image_name"])
Step 4: Let the Datadog Exporter Do Its Job
If you’re using a current version of the Datadog exporter to output telemetry from the OTel collector into Datadog, the service.name will automatically be remapped (by default) to a service tag in your Datadog logs.
This ensures your logs will appear in Datadog tagged with the correct service — following the same conventions as native agents, but with greater flexibility and visibility. Our resulting collector config snippet might look something like the following, ensuring the k8sattributes, resource and transfrom processor are after each other like:
receivers:
  filelog:
    include_file_path: true
    include:
      - /var/log/pods/*/*/*.log
    start_at: beginning
    operators:
      - type: container
        id: container_parser

processors:
  k8sattributes:
    extract:
      metadata:
        - container.image.name

  resource:
    attributes:
      - key: container.image.name
        pattern: ^.*/(?P<short_image_name>[^@:]+)
        action: extract

  transform:
    log_statements:
      - context: resource
        statements:
          - set(attributes["service.name"], attributes["short_image_name"])

exporters:
  datadog:
    api:
      site: datadoghq.com
      key: "${DATADOG_API_KEY}"  # use environment variable or secret

service:
  pipelines:
    logs:
      receivers: [filelog]
      processors: [k8sattributes, resource, transform]
      exporters: [datadog]
Final Thoughts
If you’re managing observability pipelines in Kubernetes, using OpenTelemetry gives you full control over how logs are collected, processed, and exported. With a few simple processor configurations, you can ensure your logs arrive in Datadog with accurate, consistent service tags — no matter what your container naming or deployment strategy looks like.
Want cleaner logs (and a cleaner Datadog bill)?
At ControlTheory, we help teams make sense of their telemetry — cutting out noise, fixing service tagging, and making Datadog way more useful (and less expensive).
If your logs are a mess or your service map looks like spaghetti, we can help → Grab some time with us
Table of Contents
Runtime Feedback for Agentic Engineers
Catch OTel, K8s, LLM, agentic patterns from AI-generated code - fed directly back to your agent.
 Back
Backpress@controltheory.com