Railway is one of the fastest ways to go from code to production. Push your repo, get a running service with a URL in minutes. The deployment experience is genuinely great.
But the moment something goes wrong, you’re in the Railway dashboard clicking between deployment logs, build logs, and the observability tab, trying to piece together what happened. If you’re like most developers in 2026, your next move is pasting the error into Claude or Cursor. But if the log is vague, truncated, or silently dropped, the AI is just as stuck as you are.
We built a Railway integration for Gonzo, an open-source terminal UI for real-time log analysis, that streams your Railway logs directly into a searchable, filterable terminal dashboard with AI-powered analysis. It’s a single command with zero configuration:
railway logs --json | gonzoNo poller script. No normalization layer. No jq. Railway’s CLI streams structured JSON over WebSocket, and Gonzo auto-detects the format. That’s the whole integration.
Why This Matters More Than It Sounds
Railway developers hit a few specific pain points with logs that make a terminal-based tool particularly useful:
The 500 lines/second wall. Railway enforces a hard rate limit of 500 log lines per second per replica, and when you exceed it, logs are silently dropped before they ever leave Railway’s infrastructure. You don’t get a warning. They’re just gone. This means that during the exact moments when you’re generating the most logs (a crash loop, a traffic spike, a batch job gone wrong), you’re most likely to lose the evidence you need. Gonzo can’t recover what Railway never emits, but having your logs in a persistent terminal dashboard means you can scroll back through what did arrive and use Gonzo’s severity distribution and word frequency analysis to infer what’s happening even with gaps. It’s also a good reason to adopt structured, minified JSON logging. Fewer log lines per event means more signal under the cap.
Interleaved and out-of-order logs. If you’ve ever pretty-printed a JSON object to stdout on Railway, you’ve probably seen the lines show up interleaved with other log output, making it impossible to reconstruct the original object. Structured JSON logging (single-line, minified) fixes this on the emission side, and Gonzo’s structured log parsing reconstructs the fields cleanly on the consumption side. Railway actually does you a favor here — it normalizes all incoming logs to a consistent JSON format automatically, so even plain console.log("hello") arrives as {"message":"hello","level":"info"}.
stderr = error. Railway classifies anything emitted to stderr as level: "error". This is a well-known gotcha for Python developers, where the standard logging library defaults to stderr, meaning every logging.info() call shows up as an error in Railway’s observability tab. In Gonzo, you see the actual level your app emitted, and you can filter accordingly.
What Gonzo + Railway Looks Like
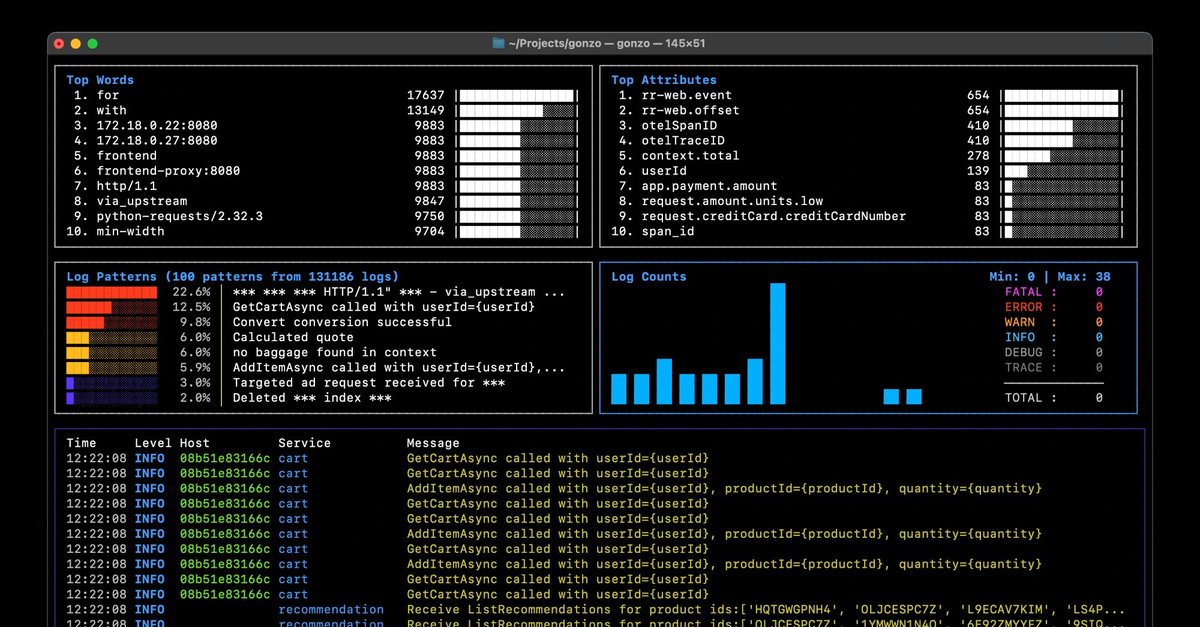
Gonzo is a terminal UI for log analysis. Think k9s, but for logs. It gives you real-time charts, severity distribution, word frequency analysis, AI-powered insights, and full-text search across your log stream. It runs entirely in your terminal and supports local AI models if you don’t want your logs leaving your machine.
The Railway integration requires no scripts or adapters. Railway’s CLI already outputs structured JSON over a WebSocket stream, and Gonzo already auto-detects JSON input. The two tools were built independently but fit together perfectly.
What you get:
- Real-time streaming: logs appear as they’re emitted, over WebSocket with no polling delay
- Structured log parsing: all JSON fields are extracted and searchable, including any custom attributes your app emits
- Severity tracking: real-time charts showing error/warn/info/debug distribution as your app runs
- AI analysis: press
ion any log entry for AI-powered root cause analysis, using OpenAI, Ollama, LM Studio, or any compatible API - Build log support: debug failed deployments with
railway logs --build --json | gonzo
Getting Started
Prerequisites
- Gonzo installed (
brew install gonzo) - Railway CLI installed (
brew install railway) - A Railway project with a deployed service
1. Authenticate and link
railway login
railway link
Select your project and environment when prompted.
2. Stream logs into Gonzo
railway logs --json | gonzoThat’s it. Logs start flowing immediately.
Tips
Debug a failed deployment by checking build logs:
railway logs --build --json --lines 100 | gonzoFetch historical logs from a specific time window:
railway logs --json --since 2h | gonzoFilter server-side before streaming to reduce noise:
railway logs --json --filter "@level:error" | gonzoWrite to a file so you can restart Gonzo without losing history:
railway logs --json > /tmp/railway.jsonl &
gonzo -f /tmp/railway.jsonl --follow
Add AI analysis with a local model (your logs never leave your machine):
export OPENAI_API_KEY="ollama"
export OPENAI_API_BASE="http://localhost:11434"
railway logs --json | gonzo
Filter in Gonzo by pressing / and typing:
| Filter | What you’ll see |
|---|---|
error | Error-level logs across all output |
GET /api | HTTP request logs matching a path |
timeout | Timeout-related messages |
heartbeat | Background task or health check logs |
What’s Covered
| Log type | Command | What it captures |
|---|---|---|
| Deployment logs | railway logs --json | App stdout/stderr: application logs, errors, structured JSON |
| Build logs | railway logs --build --json | Railpack/Nixpacks build pipeline: dependencies, compilation, image creation |
| HTTP logs | Dashboard only | Edge proxy traffic, not available via CLI |
Railway’s log format is refreshingly simple. Unlike platforms with deeply nested metadata structures requiring custom normalizers (we wrote 9 source-specific jq transforms for our Supabase integration), Railway normalizes everything into flat JSON with message, level, and timestamp at the top level. Your app’s custom structured log fields are preserved as-is. This is why the integration is a one-liner instead of a script.
A Note on Rate Limits
The streaming mode (railway logs --json | gonzo) uses a persistent WebSocket connection and is not rate limited. Stream all day. The fetch mode (--lines, --since, --until) uses Railway’s GraphQL API and is subject to plan-based limits (100/hr on Trial, 1,000/hr on Hobby, 10,000/hr on Pro).
The platform-level logging rate limit of 500 lines/second/replica applies regardless of how you consume logs. If your app is a heavy log emitter, use structured logging with minified JSON (not pretty-printed) to stay under the cap and avoid silent drops.
Contributing
The usage guide lives in the Gonzo repo:
If you run into edge cases with Railway’s log format or find something we should document, PRs and issues are welcome. Gonzo is open source (MIT) and community-driven.
Try It
brew install gonzo
brew install railway
railway login
railway link
railway logs --json | gonzo
Five commands from zero to a live log dashboard for your Railway project. Let us know how it goes. We’re in the Gonzo Slack community and on GitHub Discussions.
Table of Contents
Surface Unknown Unknowns Automatically
Catch emergent patterns from AI-generated code in staging—before they become production incidents.
Learn About Dstl8 Back
Backpress@controltheory.com