If you’ve ever stared at a vague error in the Supabase dashboard, switched between five different log panels trying to piece together what went wrong, or discovered your Edge Function failed silently with no trace – you’re not alone. Log diagnosis on Supabase is one of the most common pain points raised in community forums and GitHub Discussions, and it hits hardest when you’re debugging under pressure.
We built a Supabase integration for Gonzo – an open-source terminal UI for real-time log analysis – that pulls logs from every Supabase service into a single, searchable, filterable terminal dashboard. It works on the free tier, requires no Supabase configuration changes, and takes about two minutes to set up.
The Problem
Supabase has great developer experience for building – but when things go wrong, the debugging experience has some rough edges that most developers hit eventually:
Fragmented log surfaces. Postgres logs, Auth logs, Edge Function logs, Storage logs, API Gateway logs, Realtime logs – each lives in its own section of the dashboard with its own interface. Diagnosing an issue that touches multiple services means jumping between tabs and mentally correlating timestamps.
The Logs Explorer speaks BigQuery, not Postgres. When you do need to query logs, the Logs Explorer uses a subset of BigQuery SQL syntax – not the PostgreSQL you already know. Nested metadata requires CROSS JOIN UNNEST()operations to access fields like request headers or error details. It works, but it’s a speed bump when you’re in the middle of debugging.
Silent failures. Supabase’s own documentation acknowledges that “Functions that fail silently are hard to debug.” Auth errors often surface as generic messages like “Database error saving new user” with no additional context about what actually went wrong at the database level.
AI tools can’t help if they can’t see your logs. If you’re like most developers in 2026, your first instinct when something breaks is to paste the error into Claude, ChatGPT, or Cursor. But when the log is empty or cryptic, the AI is just as stuck as you are. The quality of your debugging is now directly tied to the quality of your log access.
None of this is a knock on Supabase – the platform is excellent and growing fast for good reason. But observability is a hard problem, especially across a distributed stack with Postgres, GoTrue, PostgREST, Edge Functions, Storage, and Realtime all running independently. A dedicated tool that unifies these signals can save you real time.
What Gonzo + Supabase Looks Like
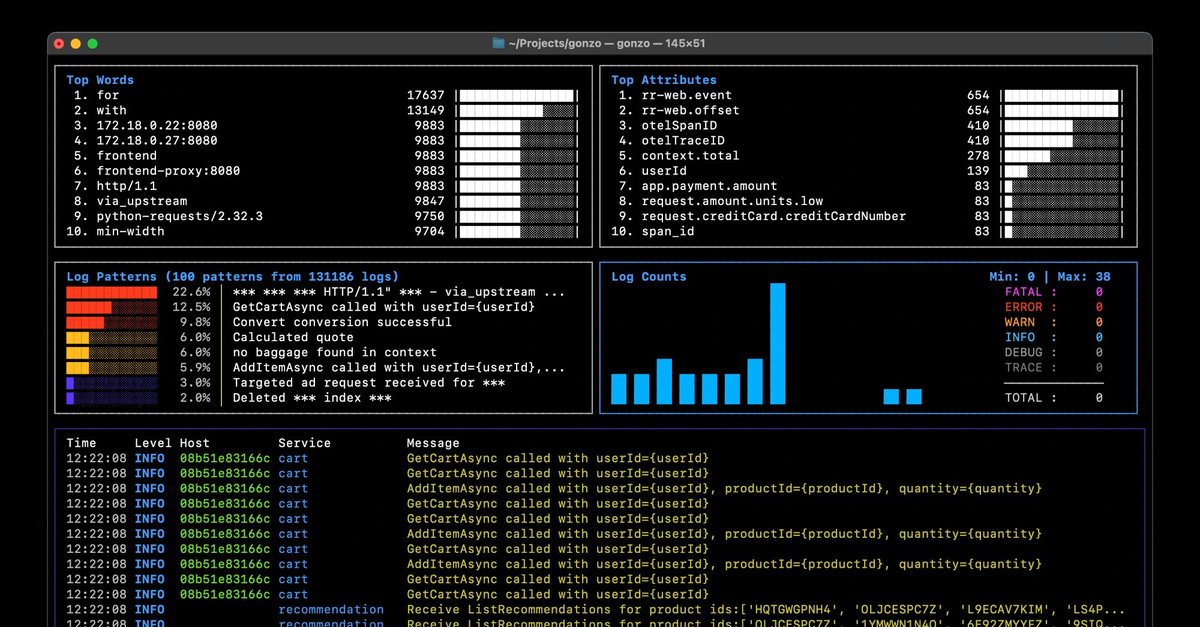
Gonzo is a terminal UI for log analysis – think k9s, but for logs. It gives you real-time charts, severity distribution, word frequency analysis, AI-powered insights, and full-text search across your log stream. It runs entirely in your terminal and supports local AI models if you don’t want your logs leaving your machine.
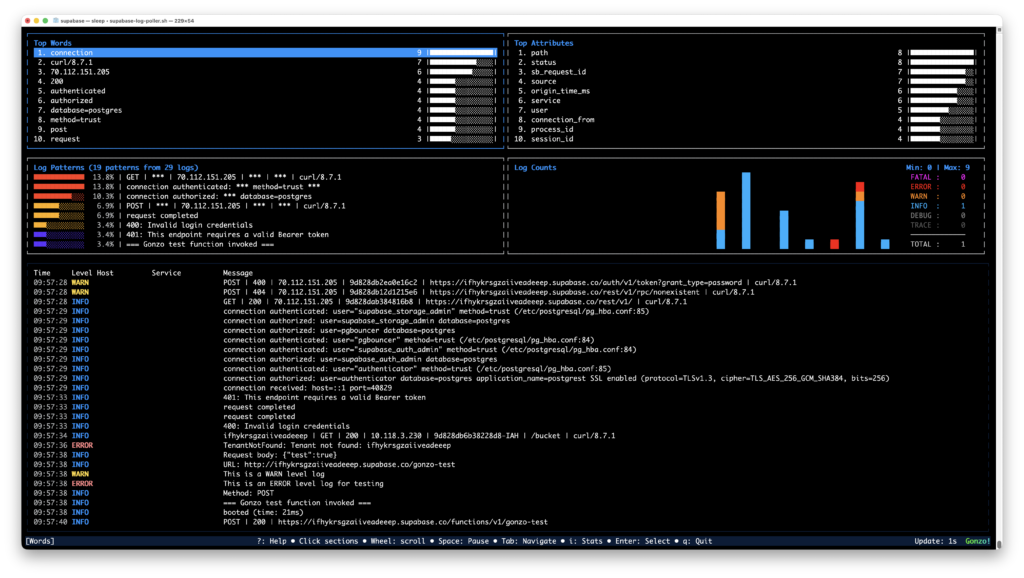
The Supabase integration is a polling script that queries the Supabase Management API across all 9 log sources, normalizes the deeply nested metadata into clean JSON, and pipes it straight into Gonzo. One command, every service, one dashboard.
./supabase-log-poller.sh | gonzoWhat you get:
- All 9 Supabase log sources in a single view – API Gateway (edge), Postgres, PostgREST, Auth, Storage, Realtime, Edge Function runtime, Edge Function network, and connection pooler
- Proper severity levels – 5xx responses show as ERROR, 4xx as WARN, successful requests as INFO. Auth and Postgres logs use their native severity levels
- Rich, searchable attributes – method, path, status code, IP, Cloudflare geo (city, region, ASN), TLS version, bot score, JWT role, execution time, database user, query text, and dozens more per source
- Filter by source – press
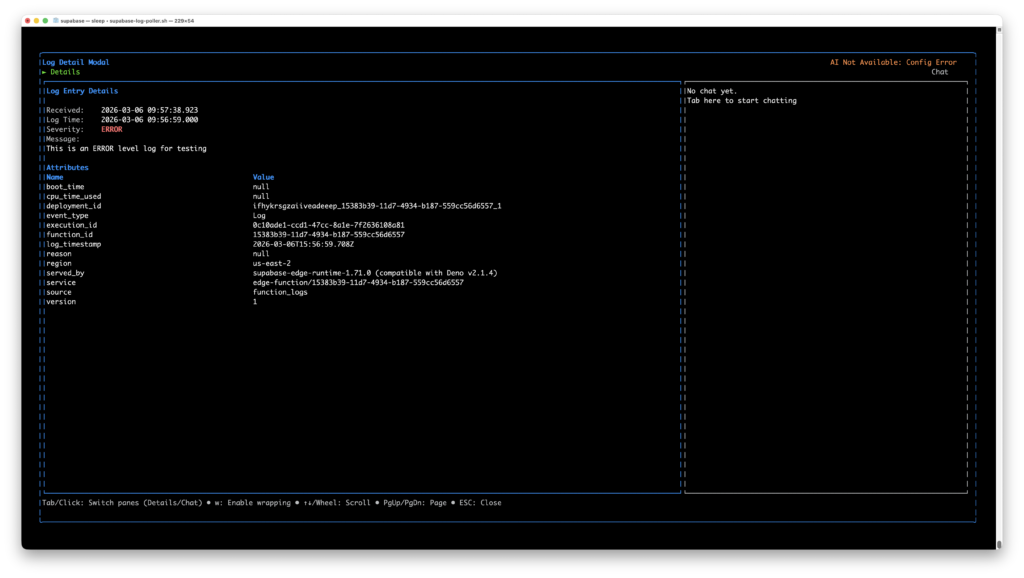
/and typeauth_logs,postgres,edge-function, or any service name to focus on what matters - AI analysis – press
ion any log entry to get AI-powered root cause analysis. Works with OpenAI, Ollama, LM Studio, or any OpenAI-compatible API
Getting Started
Prerequisites
- Gonzo installed (
brew install gonzoorgo install github.com/control-theory/gonzo/cmd/gonzo@latest) jqinstalled (brew install jq)- A Supabase project (free tier works)
1. Get your credentials
You need two things from the Supabase dashboard:
Project Ref – the string in your dashboard URL: https://supabase.com/dashboard/project/<this-part>. Also under Settings → General.
Personal Access Token – go to supabase.com/dashboard/account/tokens and generate a token. It starts with sbp_.
2. Set your environment
export SUPABASE_ACCESS_TOKEN="sbp_your_token_here"
export SUPABASE_PROJECT_REF="your_project_ref"3. Grab the poller script
# From the Gonzo repo
curl -O https://raw.githubusercontent.com/control-theory/gonzo/main/scripts/supabase-log-poller.sh
chmod +x supabase-log-poller.sh4. Run it
./supabase-log-poller.sh | gonzoThat’s it. Logs will start appearing within 30–60 seconds as Supabase’s Logflare pipeline propagates events.
Tips
Suppress poller status messages for a clean Gonzo experience:
./supabase-log-poller.sh 2>/dev/null | gonzoPoll faster during active debugging:
POLL_INTERVAL=10 ./supabase-log-poller.sh 2>/dev/null | gonzoWrite to a file instead of piping, so you can restart Gonzo without losing history:
./supabase-log-poller.sh -o /tmp/supabase-logs/all.jsonl
gonzo -f /tmp/supabase-logs/all.jsonl --followAdd AI analysis with a local model (your logs never leave your machine):
export OPENAI_API_KEY="ollama"
export OPENAI_API_BASE="http://localhost:11434"
./supabase-log-poller.sh 2>/dev/null | gonzoFilter in Gonzo by pressing “/" and typing:
| Filter | What you’ll see |
|---|---|
auth_logs | Authentication events |
postgres | Database activity |
edge-function | Function invocations |
ERROR | Server errors across all sources |
WARN | Client errors (4xx) across all sources |
How It Works Under the Hood
Supabase doesn’t offer a streaming log API, so the poller queries the Management API every 30 seconds (configurable), cycling through all 9 log sources. Each source returns deeply nested metadata arrays with completely different structures – Cloudflare edge metadata looks nothing like Postgres parsed logs, which look nothing like GoTrue auth events.
The poller runs each response through a source-specific jq normalizer that flattens the nested metadata into a common JSON structure that Gonzo auto-detects:
{
  "timestamp": "2026-03-05T14:52:18Z",
  "severity": "WARN",
  "body": "POST | 401 | /auth/v1/token",
  "source": "auth_logs",
  "service": "gotrue",
  "attributes": {
    "method": "POST",
    "path": "/token",
    "status": "401",
    "remote_addr": "71.42.201.2",
    "grant_type": "password",
    "error": "Invalid login credentials"
  }
}No Supabase configuration changes required. No log drains to set up. No paid plan needed. It reads from the same Management API that powers the Supabase dashboard’s Logs Explorer.
A note on API limits: The Supabase Management API allows 120 requests per minute per project, with stricter limits on analytics endpoints. At the default 30-second poll interval, the poller makes 18 requests per minute – well within limits. We recommend keeping POLL_INTERVAL at 10 seconds or above.
What’s Covered
| Source | Service | What it captures |
|---|---|---|
edge_logs | API Gateway | Every API request through Cloudflare – method, path, status, geo, TLS, bot score |
postgres_logs | Postgres | Queries, connections, errors, pgAudit – user, database, query text, SQL state |
postgrest_logs | PostgREST | REST API server lifecycle – schema cache reloads, config changes |
auth_logs | GoTrue | Sign-ups, logins, token ops – status, path, grant type, provider, errors |
storage_logs | Storage | Uploads, downloads, bucket ops – method, response time, object path, owner |
realtime_logs | Realtime | WebSocket events – Phoenix context, OTel traces, cluster info |
function_logs | Edge Functions | Console output – function ID, execution ID, boot time, CPU usage |
function_edge_logs | Edge Functions | Network layer – execution time, JWT role, status, edge region |
supavisor_logs | Pooler | Connection pooler activity |
Contributing
The poller script and usage guide live in the Gonzo repo:
- Script:
scripts/supabase-log-poller.sh - Guide:
guides/SUPABASE_USAGE.md
If you run into issues, find a log source we’re not normalizing correctly, or want to add attributes – PRs and issues are welcome. Gonzo is open source (MIT) and community-driven.
Try It
If you’re building on Supabase and have ever wished you could see all your logs in one place, give it a shot:
brew install gonzo
brew install jq
curl -O https://raw.githubusercontent.com/control-theory/gonzo/main/scripts/supabase-log-poller.sh
chmod +x supabase-log-poller.sh
export SUPABASE_ACCESS_TOKEN="sbp_..."
export SUPABASE_PROJECT_REF="your-ref"
./supabase-log-poller.sh 2>/dev/null | gonzoSix commands from zero to a full observability dashboard for your Supabase project. Let us know how it goes – we’re in the Gonzo Slack community and on GitHub Discussions.
Table of Contents
Surface Unknown Unknowns Automatically
Catch emergent patterns from AI-generated code in staging—before they become production incidents.
Learn About Dstl8 Back
Backpress@controltheory.com