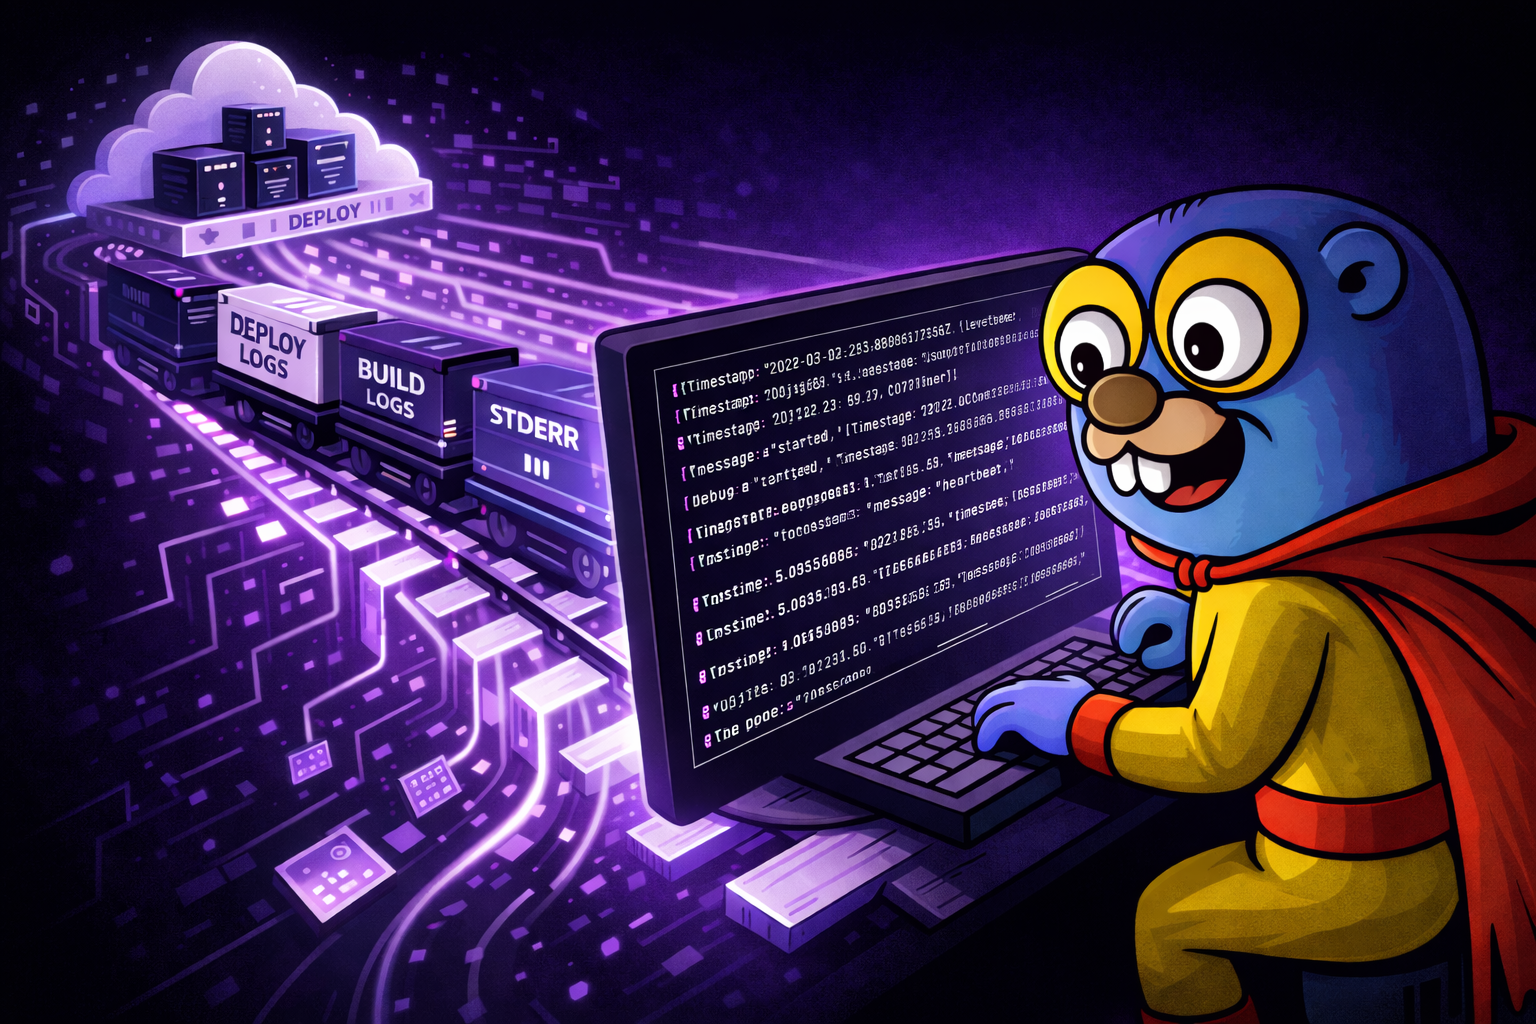
Render nails deployment. The gap has always been what happens after. Your app is running, something looks off, and your choices are: click around the dashboard log viewer, or set up a syslog drain to a paid third-party provider. Neither is great when you just want to see what your service is doing right now.
Render shipped a proper CLI in late 2024 – including WebSocket-based log streaming – which was a big step forward. We built a Gonzo integration on top of it. The result is a live terminal log dashboard with severity tracking, pattern detection, and AI-powered analysis for any Render service. No drain configuration. No third-party account. No Render-side setup at all.
render logs -r <service-id> -o json --tail \
  | jq --unbuffered -c '{timestamp: .timestamp, message: .message}
    + ([.labels[] | {(.name): .value}] | add)' \
  | sed -u 's/\\u001b\[[0-9;]*m//g; s/\\u001b(B//g' \
| gonzoUnlike our Railway integration which is a zero-config one-liner, Render needs a lightweight jq transform to flatten its label metadata and a sed pass to strip ANSI escape codes from build messages. But the result is the same: a live, searchable terminal dashboard for your production logs with no third-party services and no configuration on the Render side.
Why This Matters for Render Developers
Render has had a well-documented logging gap that the community has been vocal about. Three pain points in particular make a terminal-based tool worth setting up:
The dashboard log viewer is your only option (unless you pay for a drain). Render’s built-in log viewer works, but it’s a web UI. You can’t pipe it, grep it, or keep it running in a split pane while you code. If you want logs anywhere other than the browser, your only official path is a syslog drain to a third-party provider – Papertrail, Datadog, Logtail, Sumo Logic. These all cost money and require configuration. Community forums are full of threads about drains silently breaking, logs never arriving in Datadog, and Papertrail streams randomly stopping. Gonzo reads directly from the CLI’s WebSocket stream. Nothing to configure on the Render side. No third-party account. Free.
No terminal log tailing (until recently). If you migrated from Heroku – and many Render users did – you expected heroku logs --tail to have an equivalent. For years, it didn’t. Render shipped their CLI in late 2024 with render logs --tail, which finally closed this gap. Gonzo builds on top of that: instead of raw JSON scrolling past in your terminal, you get severity charts, word frequency analysis, pattern detection, and the ability to press i on any log entry for AI-powered root cause analysis.
Logs are ephemeral and limited by plan. Render’s log retention depends on your workspace plan. Once logs age out, they’re gone – even if you upgrade later. The platform also enforces a cap of 6,000 log lines per minute per instance, with excess lines silently dropped. Gonzo doesn’t solve retention (it’s a live tool, not a log store), but having a persistent terminal dashboard means you can scroll back through what arrived during your session and use Gonzo’s analysis tools to extract signal from what you have.
How the Integration Works
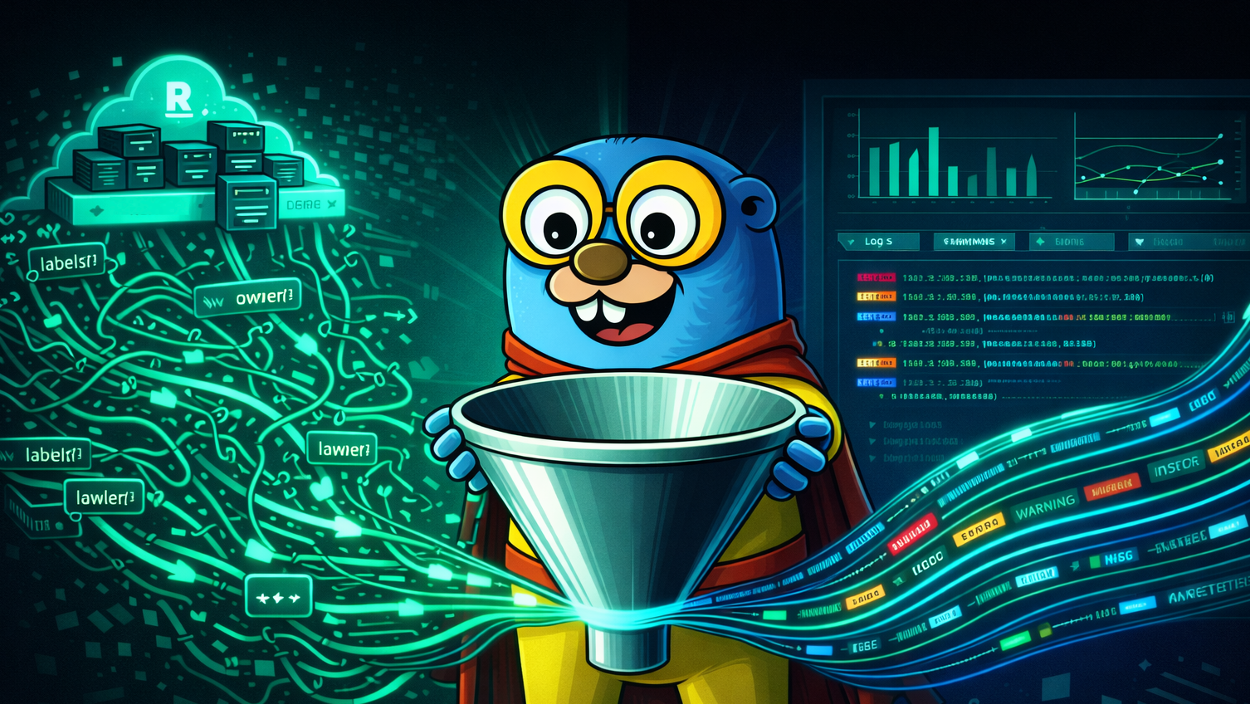
Render’s CLI streams logs over WebSocket when you pass --tail. Each log line arrives as a JSON object, but unlike Railway’s flat format, Render wraps its metadata in a labels array:
{
"labels": [
{ "name": "resource", "value": "srv-abc123" },
{ "name": "instance", "value": "srv-abc123-54m4m" },
{ "name": "level", "value": "info" },
{ "name": "type", "value": "app" }
],
"message": "{\"level\":\"info\",\"message\":\"heartbeat\"}",
"timestamp": "2026-03-27T14:34:36.521Z"
}The jq transform in the pipe dynamically flattens all labels into top-level fields. This means if Render adds new labels in the future (like method, path, and status_code for HTTP request logs on Professional plans), they’ll appear automatically – no changes to the command.
The sed -u pass strips ANSI color codes that Render injects into build and deploy messages. Without it, you get \u001b[32m garbage in your log viewer. The -u flag is critical – it disables sed’s output buffering, which otherwise causes logs to stall in the pipe for minutes.
Build, deploy, and runtime logs all come through a single stream. You can identify the phase by which labels are present:
| Phase | Labels present | Example message |
|---|---|---|
| Build | resource, level, type | ==> Running build command 'yarn'... |
| Deploy | resource, type | ==> Your service is live 🎉 |
| Runtime | resource, instance, level, type | Your app’s structured log output |
What Gonzo + Render Looks Like
Once connected, Gonzo gives you:
- Real-time streaming over WebSocket with no polling delay
- All log phases in one view – build, deploy, and runtime
- Severity tracking – real-time charts showing error/warn/info distribution
- Pattern detection – word frequency and recurring patterns across your log stream
- AI analysis – press
ion any log entry for root cause analysis using OpenAI, Ollama, or any compatible API - Multi-service tailing – pass multiple service IDs to
-rto stream logs from your entire stack in one dashboard
Getting Started
Prerequisites
- Gonzo installed (
brew install gonzo) - Render CLI installed (
brew install render) jqinstalled (brew install jq)
1. Authenticate and find your service
render login
render services -o json | jq '.[].service | {id, name}'2. Stream logs into Gonzo
render logs -r srv-XXXXX -o json --tail \
| jq --unbuffered -c '{timestamp: .timestamp, message: .message}
+ ([.labels[] | {(.name): .value}] | add)' \
| sed -u 's/\\u001b\[[0-9;]*m//g; s/\\u001b(B//g' \
| gonzoLogs start flowing immediately.
Tips
Stream multiple services at once:
render logs -r srv-XXXXX,srv-YYYYY -o json --tail \
| jq --unbuffered -c '{timestamp: .timestamp, message: .message}
+ ([.labels[] | {(.name): .value}] | add)' \
| sed -u 's/\\u001b\[[0-9;]*m//g; s/\\u001b(B//g' \
| gonzoThe resource label in each log line tells you which service emitted it.
Query historical logs from a specific time window:
render logs -r srv-XXXXX -o json --limit 100 \
--start 2026-03-27T14:00:00Z --end 2026-03-27T15:00:00Z \
| jq -c '{timestamp: .timestamp, message: .message}
+ ([.labels[] | {(.name): .value}] | add)' \
| sed -u 's/\\u001b\[[0-9;]*m//g; s/\\u001b(B//g' \
| gonzoFilter server-side before streaming:
render logs -r srv-XXXXX -o json --tail --level error | ...
render logs -r srv-XXXXX -o json --tail --text "timeout" | ...Add AI analysis with a local model (your logs never leave your machine):
export OPENAI_API_KEY="ollama"
export OPENAI_API_BASE="http://localhost:11434"
render logs -r srv-XXXXX -o json --tail | ... | gonzoStructured Logging Tips
Render parses your app’s stdout and maps the level field to its internal severity system. If your app emits structured JSON with a level field, Render correctly lifts it to the envelope. For the best Gonzo experience, emit structured JSON with at least message and level:
console.log(JSON.stringify({
message: "User signup completed",
level: "info",
userId: 123,
provider: "github"
}));Like Railway, Render tags all stderr output as errors. Python’s logging library defaults to stderr, so logging.info() calls show up as errors. Use structured JSON logging to override this.
Contributing
The full usage guide lives in the Gonzo repo: guides/RENDER_USAGE_GUIDE.md
If you find edge cases with Render’s log format or want to improve the integration, PRs and issues are welcome. Gonzo is open source (MIT) and community-driven.
Try It
brew install gonzo
brew install render
brew install jq
render login
render logs -r <service-id> -o json --tail \
  | jq --unbuffered -c '{timestamp: .timestamp, message: .message}
    + ([.labels[] | {(.name): .value}] | add)' \
  | sed -u 's/\\u001b\[[0-9;]*m//g; s/\\u001b(B//g' \
| gonzoLet us know how it goes. We’re in the Gonzo Slack community and on GitHub Discussions.
Table of Contents
Surface Unknown Unknowns Automatically
Catch emergent patterns from AI-generated code in staging—before they become production incidents.
Learn About Dstl8 Back
Backpress@controltheory.com