Intro
The promise of AI for Site Reliability Engineering (AI SRE) is huge: faster root cause analysis, reduced MTTR, proactive incident prevention, and even potential automated remediation. But here’s the problem—how do we know if an AI SRE tool is actually effective? Without a repeatable, objective benchmark, evaluating AI SRE tools (or your own homegrown solutions) is almost impossible.
In this series, we’ll walk through how to:
- Set up an objective test environment for AI SRE evaluation (this post).
- Generate realistic failure data from a live application.
- Feed this data into different AI-powered observability solutions and measure their accuracy and speed in detecting and diagnosing issues.
Why Benchmarks Matter for AI SRE
If we want to evaluate AI SRE tools fairly, we need more than anecdotes—we need repeatable, controlled test scenarios.
Kudos to the IBM ITBench project for taking early steps in this direction:
- GitHub: ITBench Scenarios
- Paper: ITBench Arxiv PDF
ITBench leverages realistic applications (including the OpenTelemetry Demo) to simulate failure scenarios and collect metrics across multiple SRE tasks. This is exactly the kind of thinking we need in AI SRE—because it’s only with objective benchmarks that we can say whether a tool improves reliability, or just looks (or sounds) impressive.
In this post, we’ll take inspiration from ITBench and set up a simpler, controlled environment for testing AI-driven incident detection and root cause analysis.
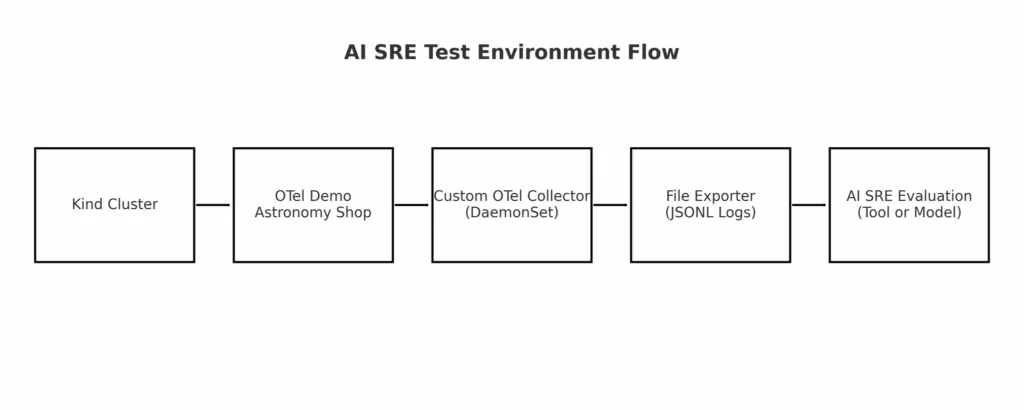
Step 1: The Test Application — OTel Astronomy Shop
We’ll use the OpenTelemetry Demo—a microservices-based “Astronomy Shop” application.
It comes with:
- Multiple microservices in different languages
- Built-in instrumentation with OpenTelemetry
- 11 feature flags for introducing realistic failures (feature flags reference)
On the potential downsides of using this demo app:
- Astronomy Shop is a “well known” application – any AI SRE solution will need to deal with a wide variety of custom applications in the real world – not just the well known ones
- It’s well instrumented – by design! It’s a reference demo application for OTel after all! Our own applications may be instrumented “less well” and any AI SRE solution will have to be robust to missing/poor instrumentation etc…. (although we can theoretically test such robustness here as well by dialing back key signals from our applications/infra etc…)
Step 2: Deploying the Application
# Create a Kind cluster
kind create cluster --name ai-sre-bench

# Deploy the OTel Demo to Kubernetes
kubectl apply -f <https://raw.githubusercontent.com/open-telemetry/opentelemetry-demo/main/k8s/kubernetes.yaml>
Tip: When running on my (M2) Mac, I had to raise the memory limit on the flagd deployment to avoid CrashLoopBackoff which can be patched as follows assuming deployment in the default namespace:
kubectl patch deployment flagd \\
  --type='json' \\
  -p='[{"op":"replace","path":"/spec/template/spec/containers/1/resources","value":{"limits":{"memory":"200Mi"},"requests":{"memory":"200Mi"}}}]'
Step 3: Our Own OpenTelemetry Collector (DaemonSet)
While the OTel Demo ships with its own collector, we’ll deploy our own collector as a DaemonSet so we have:
- Full control over which logs we capture
- Custom metadata enrichment
- The ability to export logs to local files for offline analysis
Following ControlTheory’s Kubernetes log enrichment guide, we’ll:
- Use the filelog receiver to collect container logs
- Use the k8sattributes processor to enrich logs with Kubernetes metadata
- Use the k8sobject receiver to capture important K8s API events (e.g., pod restarts)
- Export all logs to a local file via the file exporter
Example Collector config snippet:
receivers:
  filelog:
    include:
      - /var/log/pods/*/*/*.log
    start_at: beginning
  k8sobjects:
    objects:
      - name: events
        mode: watch

processors:
  k8sattributes:
    auth_type: serviceAccount

exporters:
  file:
    path: /var/tmp/logsexport.json

service:
  pipelines:
    logs:
      receivers: [filelog, k8sobjects]
      processors: [k8sattributes]
      exporters: [file]
Step 4: Running Controlled Failures
The OTel Demo provides 11 feature flags you can toggle to introduce realistic failures. If we set up port forwarding on our K8s OTel Demo environment, we should be able to navigate to http://localhost:8080/feature to see the flags that can be toggled on/off in our demo app:
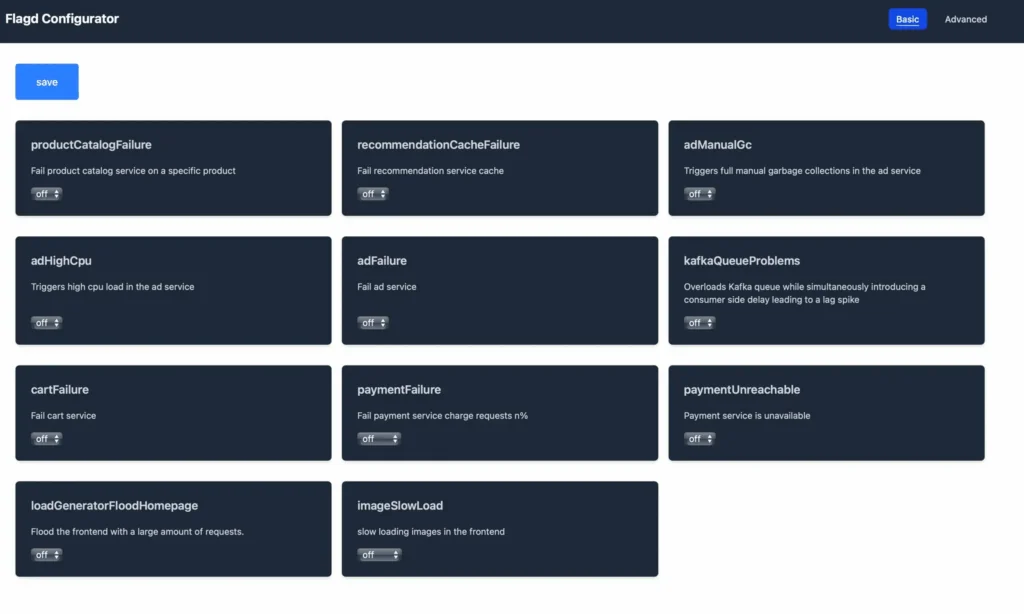
Some flags have additional parameters such as the payment-failure flag, which can cause payment failures in a custom % of requests.
We’ll follow a repeatable testing pattern:
- Capture 2–3 minutes of “healthy” logs.
- Trigger a failure flag.
- Capture 2–3 minutes of “degraded” logs.
Step 5: Our Output Datasets
At the end of each test run, we’ll have:
- Before-failure logs
- After-failure logs
- Known timestamp when the failure began
- Kubernetes events tied to the failure
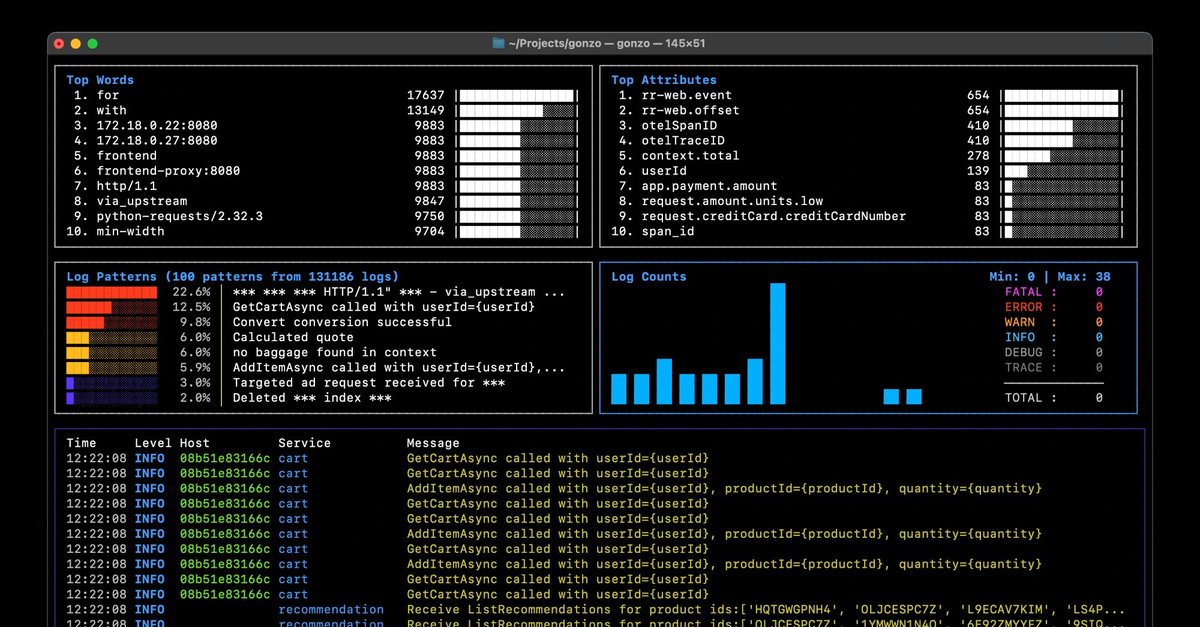
This gives us the (raw) ground truth data we need to test any AI SRE solution—whether it’s a commercial tool, an open-source project, or a homegrown LLM pipeline. While we are leveraging logs in the example here, this setup is also extensible for other signals including metrics and traces.
Next Steps in AI SRE Evaluation
In the next post in this series, we’ll:
- Experiment with different AI models and log parsing approaches.
- Define metrics for “AI SRE efficacy” (e.g., detection latency, diagnosis accuracy).
- Compare how well each approach surfaces the real root cause from the noise.
Table of Contents
Surface Unknown Unknowns Automatically
Catch emergent patterns from AI-generated code in staging—before they become production incidents.
Learn About Dstl8 Back
Backpress@controltheory.com