Introduction: AI + SRE = New Requirements
AI is rapidly reshaping how we approach observability and operations. From summarizing incidents to surfacing root causes and forecasting outages, AI promises a world where Site Reliability Engineers (SREs) spend less time chasing dashboards and more time solving meaningful problems. But AI can’t reason its way to insight without clean, structured, and timely data. That’s where OpenTelemetry (OTel) becomes foundational.
What Is OpenTelemetry and Why It Matters
OpenTelemetry (or OTel for short) is an open standard for collecting logs, metrics, and traces (with other signals on the way) from applications and infrastructure. It’s vendor-neutral, supported by every major observability platform, and backed by the CNCF. But its real value goes beyond avoiding vendor lock-in.
Use OTel to Create Structure
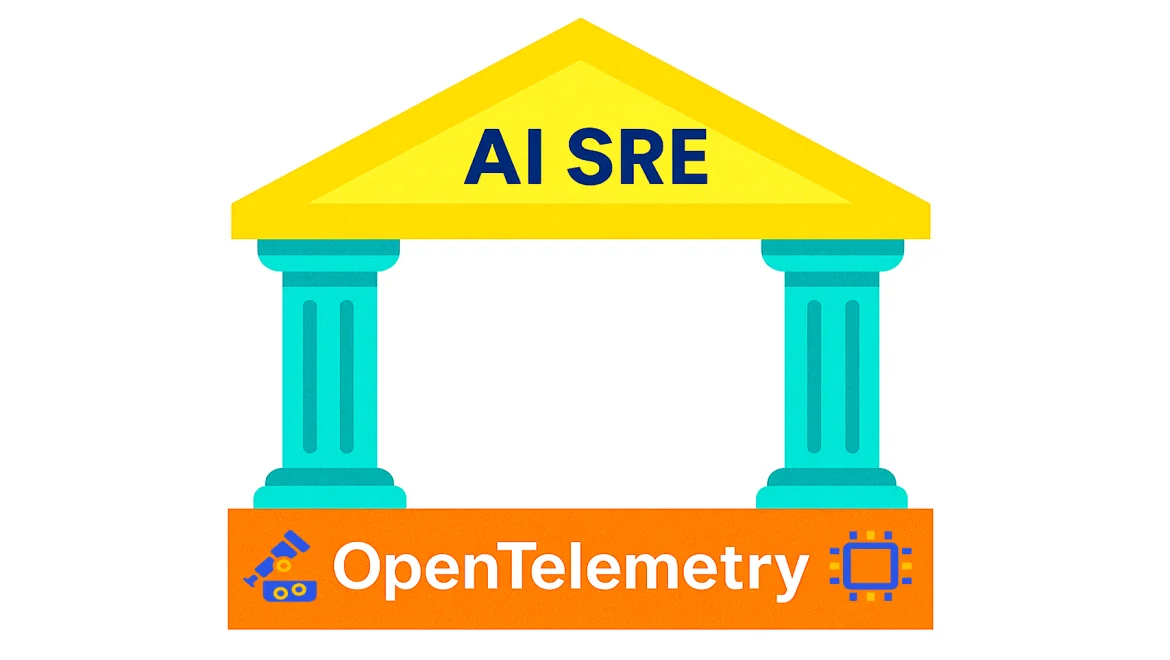
OTel is the plumbing of AI SRE. It delivers structured, correlated telemetry — the raw materials AI needs to reason about system behavior. Without OpenTelemetry, AI models are left guessing in a sea of inconsistent and disconnected data.
The Three Pillars: Logs, Metrics, Traces
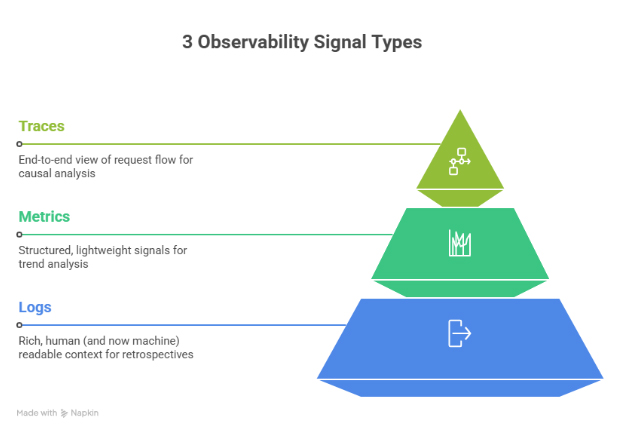
OpenTelemetry unifies the three core observability signals:
- Logs are the most widely adopted. They offer rich, human-readable context and are essential for incident retrospectives.
- Metrics provide structured, lightweight signals that are ideal for trend analysis and triggering alerts.
- Traces are the hardest to adopt but the most valuable for causal analysis. They show how a request moves through your system.
Tracing requires developers to think beyond their service boundary — a challenge when the mental model often stops at “me” and doesn’t (always!) extend to “not me.” But it’s precisely this end-to-end view that makes tracing indispensable for AI-assisted RCA.
Reality Check: Gaps and Ambiguity Are Inevitable
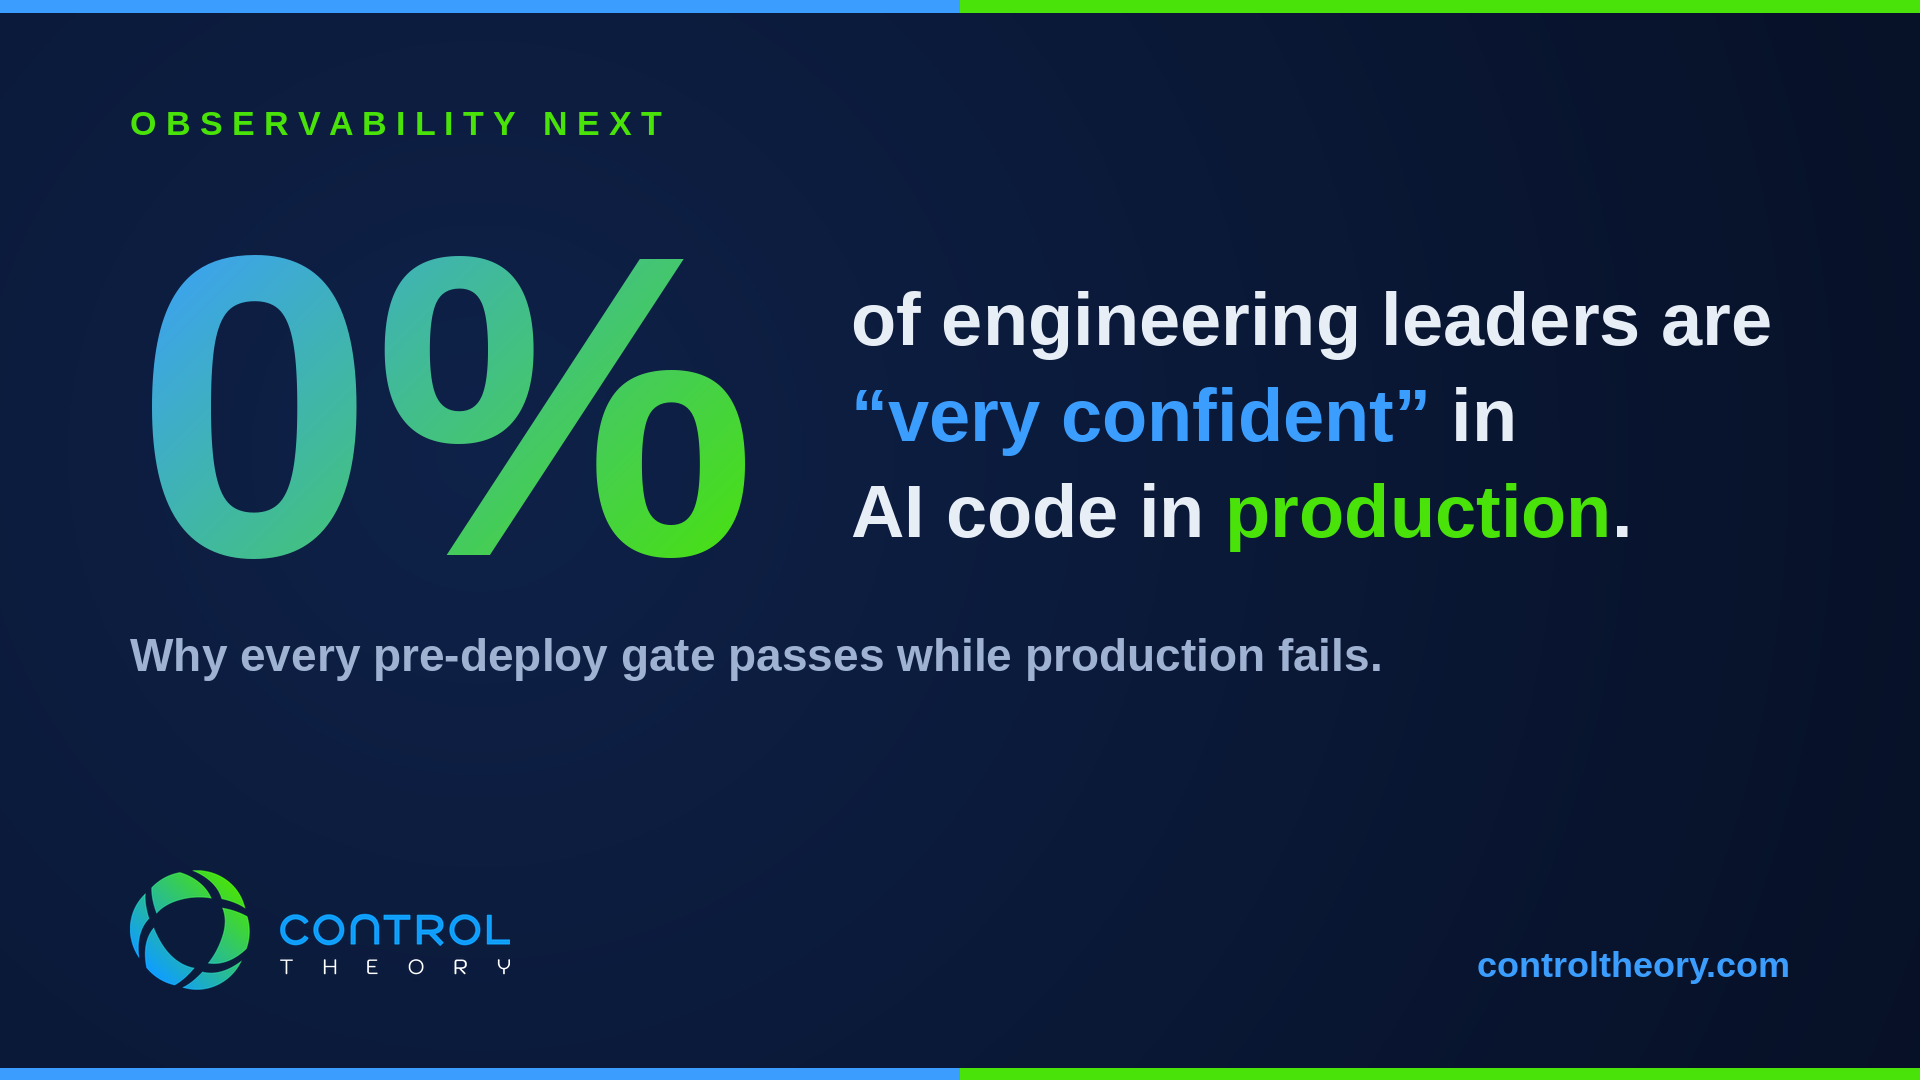
Real-world telemetry is messy. Spans are missing. Logs are noisy. Metrics are misnamed or lack labels. AI must be robust to partial, ambiguous input — just like a human operator. But if we want accurate summaries and useful recommendations, we need to improve our inputs.
Instrumentation: Garbage In, Garbage Out
Instrumentation quality directly impacts AI utility. Manual instrumentation is fragile and inconsistent. That’s why auto-instrumentation is a game-changer:
- OpenTelemetry auto-instrumentation agents exist for major languages (Java, Python, .NET, Node.js).
- eBPF-based tools like Beyla allow zero-code instrumentation at the kernel level.
The Problem with SRE Automation
Auto-instrumentation dramatically lowers the barrier to adoption, accelerates coverage, and ensures more consistent signal quality. It’s not all roses though, since we can potentially end up with even more telemetry data that may not necessarily be useful to drive desired outcomes (see Smart Edge layer below).
Semantic Conventions: Making AI’s Job Easier
OpenTelemetry’s semantic conventions ensure consistency in how telemetry data is labeled and structured. Fields like http.status_code, k8s.pod.name, and db.system follow strict naming rules.
This consistency is gold for AI:
- Easier correlation across signals
- Better feature engineering for LLMs
- Improved model performance during inference
You can’t train on chaos. Semantic conventions turn chaos into clarity – and lead some to say “Why Semantic Conventions are OpenTelemetry’s Most Important Contribution”.
The OpenTelemetry Collector: The Smart Edge Layer
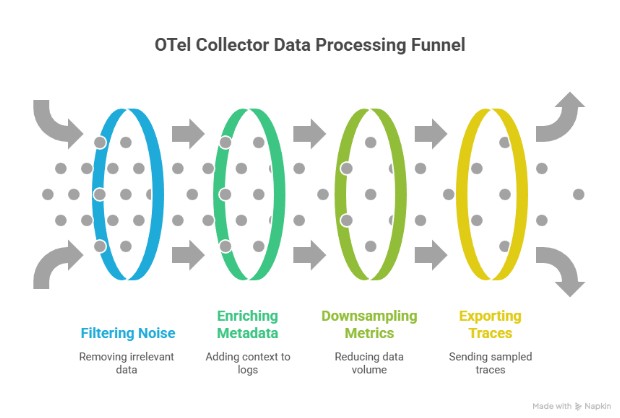
The OpenTelemetry Collector acts as a programmable router/switch and processor for telemetry data. It runs close to your applications — often as a sidecar, DaemonSet, or gateway — and can:
- Filter noise
- Enrich logs with (e.g. Kubernetes/app) metadata
- Downsample or aggregate metrics
- Export boiled-down (e.g. sampled) traces
With the right control plane or orchestration layer, the collector becomes a policy engine that distills telemetry to just what’s needed: the Goldilocks signals — not too little, not too much, just right for AI to reason about what went wrong.
Goldilocks vs. Data Lakes
The traditional model of observability has been to collect everything and throw it in a data lake. That’s expensive, slow, and increasingly unworkable.
AI SRE doesn’t benefit from more data. It benefits from better data.
Collectors let you pre-process, filter, and enrich data at the edge. That means faster insights, reduced storage costs, and real-time signals ready for AI consumption — without waiting on a slow, expensive query over petabytes of junk.
Shout Out: OTel Entities SIG
The OpenTelemetry Entities SIG is working to add metadata to telemetry – effectively an overlay on top of existing signals to associate them with entities (host, process etc…), and relationships that have their own lifecycle. This means:
- Tracking lifecycle of services, containers, pods
- Mapping relationships between entities
With this layer, AI can understand not just what happened, but how things are connected — essential for causality and correlation in complex systems.
Conclusion: OTel Is No Longer Optional for AI SRE
OpenTelemetry isn’t just an open standard — it’s the foundation of AI-assisted operations. Without it:
- You’re locked in to proprietary formats.
- Your AI is guessing from inconsistent inputs.
- Your observability costs balloon with no added insight.
With it, you get structured, connected, real-time data that’s ready for LLMs, anomaly detectors, and self-healing systems.
AI SRE is coming fast. OpenTelemetry is how you prepare for it.
FAQ – AI SRE & Observability
AI SRE denotes the use of agentic AI systems to triage alerts, diagnose production issues, and—under bounded conditions—execute remediation workflows. Unlike a conversational assistant that comments on dashboards, an AI SRE is defined by its capacity to plan and act across an existing SRE toolchain, with humans supervising outcomes rather than performing every investigative step.
AI SRE and SRE automation with AI diverge mainly in how uncertainty is handled:
- Automation executes deterministic runbooks; AI SRE reasons under incomplete evidence
- Automation typically assumes stable inputs; AI SRE tolerates messy telemetry and ambiguity
- Automation is task-scoped; AI SRE is goal-scoped (e.g., “reduce error rate,” “restore SLO”)
- Automation rarely builds narrative causality; AI SRE attempts correlation and causal inference across distributed systems
- Automation often lacks memory of prior incidents; AI SRE aims to reuse historical context when available
Used well, AI SRE is an extension of automation, not a replacement for engineering judgment.
OpenTelemetry (OTel) is an open standard for collecting and exporting logs, metrics, and traces. Its operational value is less about “another tool” and more about normalizing telemetry into a consistent, correlated form that can support troubleshooting, alerting, and post-incident analysis across distributed systems.
OTel is foundational for AI SRE because AI cannot reliably infer causality from disconnected telemetry. When logs, metrics, and traces are inconsistently labeled or poorly correlated, AI “reasoning” degenerates into guesswork. OTel’s standardization—especially its semantic conventions and collector layer—turns raw observability into structured evidence that can be queried, correlated, and acted upon.
In distributed systems, the three signals contribute distinct evidence classes for AI SRE:
- Logs provide localized, high-context state transitions and error narratives
- Metrics provide low-latency trend signals for detection and alert thresholds
- Traces provide end-to-end causal pathways across service boundaries
- Correlation across the three reduces false attribution (e.g., blaming the “slow service” rather than the upstream trigger)
- Traces become disproportionately valuable when an incident spans multiple owners or clusters
- A monitoring system becomes more explainable when these signals share consistent attributes
- AI recommendations become more falsifiable when they can cite concrete telemetry evidence
The four golden signals (also queried as “4 golden signals” or “SRE golden signals”) are a minimal, service-centric set for monitoring user-facing systems:
- Latency (ideally separated for successful vs failed requests)
- Traffic (demand level: requests, throughput)
- Errors (failure rate and error types)
- Saturation (resource exhaustion signals: CPU, memory, queues, etc.)
A well-designed SRE dashboard usually expresses these four golden signals first, then adds system-specific diagnostics second.
To capture golden signals with OpenTelemetry, the priority is semantic consistency and low-noise collection:
- Emit request duration metrics (histograms) for latency distributions, not just averages
- Emit request counts and throughput for traffic, scoped per endpoint/service
- Emit error rate metrics and trace/span status signals for failures
- Emit saturation signals from infrastructure (CPU/memory) plus service-level queues
- Use consistent attribute keys so aggregation remains stable across services
- Prefer collector-side enrichment and filtering to reduce telemetry inflation
This mapping is straightforward; the discipline is keeping it coherent at scale.
The OpenTelemetry Collector (or OTel Collector) is best understood as a control point in an observability pipeline: it can transform, enrich, and route telemetry before it lands in storage or alerting. ControlTheory frames this as a “smart edge layer,” where the collector becomes a policy engine that produces “just right” signals for AI reasoning, rather than exporting petabytes of undifferentiated data.
An AI SRE agent (also searched as “SRE AI agent” or “agentic AI SRE”) is characterized by operational autonomy within bounds:
- It perceives the environment via telemetry and tool APIs (observability, infra, CI/CD)
- It forms and updates an investigation plan as evidence changes
- It executes multi-step tasks (triage → hypothesis → verification → action)
- It records rationale so humans can audit the causal chain
- It escalates when confidence, blast radius, or policy requires human control
- It improves over time via incident history and feedback loops
- It is evaluated on reliability outcomes (e.g., MTTR reduction), not fluency
The AI SRE role in incident management is best framed as “front-loading” investigation work so humans decide with better context:
- Rapid triage: severity, scope, and likely customer impact
- Evidence collection: logs/metrics/traces correlated into a coherent timeline
- Hypothesis ranking: most probable causes surfaced with supporting artifacts
- Similar-incident retrieval: prior incidents and changes linked when possible
- Drafting next actions: mitigations, rollbacks, or escalation recommendations
This is valuable precisely when incidents are noisy, multi-service, and time-compressed.
We help teams operationalize AI SRE by turning OpenTelemetry-based telemetry into structured, queryable incident evidence—so an AI SRE agent (or human on-call) can reason from facts rather than fragmented dashboards. We do this with:
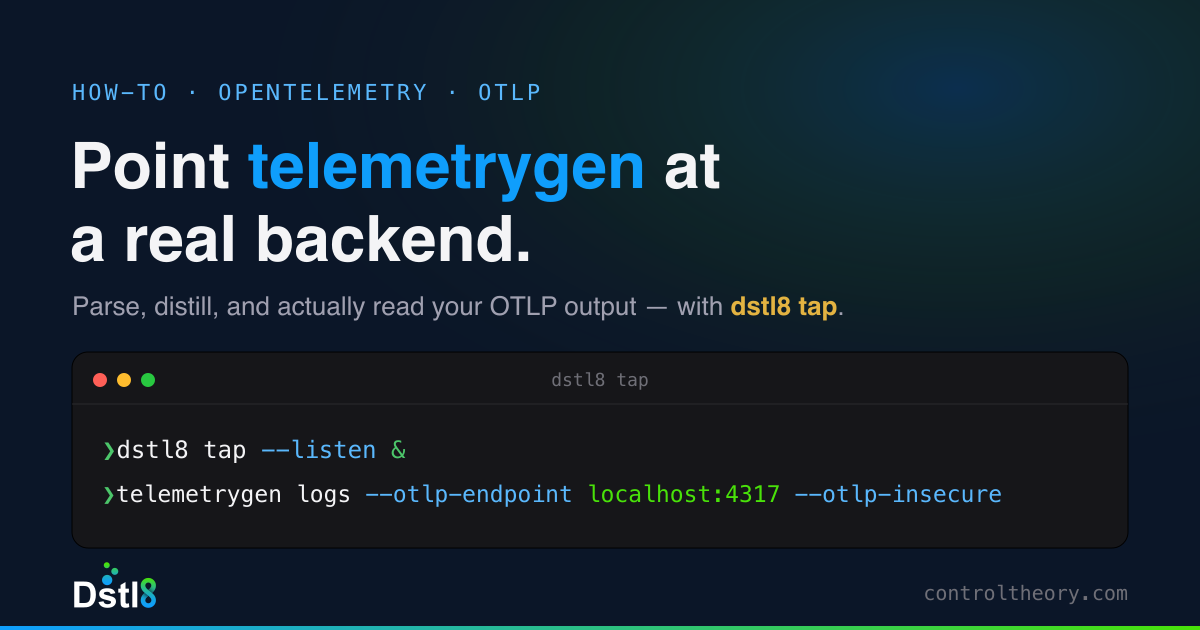
- Dstl8: our observability distillation layer that ingests OTel signals and produces concise, high-signal “incident packets” (correlated logs, timelines, and likely blast radius) suitable for rapid triage and RCA.
- Möbius: our continuous investigation layer that maintains context as conditions change, continuously re-evaluating hypotheses against fresh telemetry and surfacing the most decision-relevant evidence.
- Policy-oriented signal shaping: we emphasize “just-enough” telemetry, analyzing everything, pulling out key signals and patterns but not “collecting everything”, to reduce noise and cost and cognitive load, while preserving causal traceability.
- Correlate patterns across services/clusters to establish incident scope
- Provide “answers with evidence” (relevant log lines, timelines, affected services)
- Operate Kubernetes-native where needed and align with OpenTelemetry standards
- Reduce dashboard chasing by producing structured summaries for downstreamteams
Table of Contents
Runtime Feedback for Agentic Engineers
Catch OTel, K8s, LLM, agentic patterns from AI-generated code - fed directly back to your agent.
 Back
Backpress@controltheory.com