If you’ve been using Gonzo to pipe logs into your terminal, you already know the basics. But there’s a lot more hiding beneath the surface — AI analysis, attribute search, native Kubernetes support, theming, and integrations with practically every log source in your stack. This post covers the tips and recent enhancements that will change how you debug.
Quick Recap: What Is Gonzo?
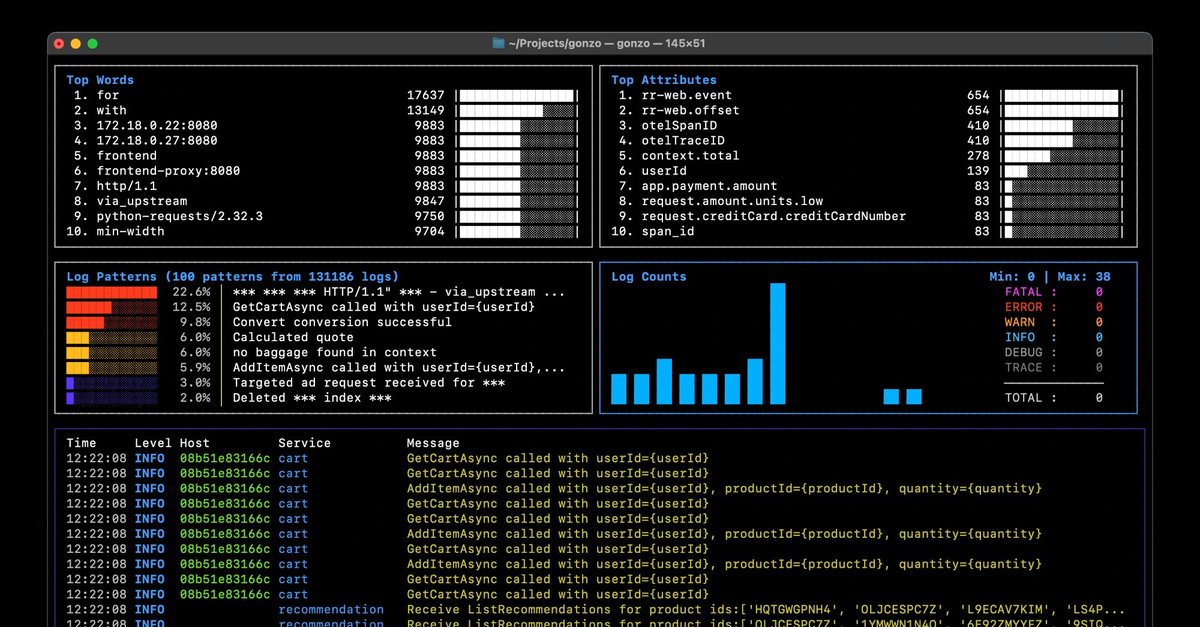
Gonzo is a Go-based terminal UI for real-time log analysis, inspired by k9s. Pipe any log stream into it and you get instant visual analysis: severity distribution, word frequency, time series charts, and attribute breakdowns — all in your terminal.
There are three ways to get logs in:
# 1. Pipe from stdin (works with anything)
docker logs -f my-container 2>&1 | gonzo
cat application.log | gonzo

# 2. Read files directly (supports globs + follow mode)
gonzo -f /var/log/app.log --follow
gonzo -f "/var/log/*.log"

# 3. Native integrations (no piping needed)
gonzo --k8s-enabled=true --k8s-namespace=production
gonzo --otlp-enabled    # receive OTLP logs directly
gonzo --vmlogs-url="http://localhost:9428"
Install via Homebrew, Go, or Nix:
brew install gonzo
go install github.com/control-theory/gonzo/cmd/gonzo@latest
nix run github:control-theory/gonzo
Pro Tips
1. AI Analysis — Including Fully Local
You don’t need an OpenAI key to use Gonzo’s AI features. It works with Ollama, LM Studio, or any OpenAI-compatible API, which means your logs never have to leave your machine.
# Ollama (fully local, fully private)
export OPENAI_API_KEY="ollama"
export OPENAI_API_BASE="http://localhost:11434"
gonzo -f logs.json

# LM Studio
export OPENAI_API_KEY="local-key"
export OPENAI_API_BASE="http://localhost:1234/v1"
gonzo -f logs.json
Once you’re in a session, press i on any log entry to get AI analysis of it, m to switch models on the fly, or c in the detail view to open a chat about that specific log. This is especially useful when you’re staring at an unfamiliar error and want a second opinion without leaving the terminal.
2. The Keyboard Shortcuts Worth Memorizing
Gonzo is keyboard-driven, and knowing these shortcuts is the difference between fumbling through logs and actually finding what you need fast:
| Shortcut | What it does |
|---|---|
f | Fullscreen log viewer |
Space | Pause the entire dashboard |
/ | Filter (regex supported) |
s | Search & highlight without filtering |
Ctrl+f | Severity filter modal |
Ctrl+k | Kubernetes filter modal |
c | Toggle namespace/pod or host/service columns |
Enter on Counts | Heatmap + analysis modal |
Space is underrated — being able to freeze the dashboard mid-stream while you investigate a spike is something you’ll reach for constantly.
3. Attribute Search: Filter on Structured Fields
The / filter doesn’t just search message text. It automatically searches across attribute keys and values from your structured JSON logs. So if your logs have fields like service.name, request_id, or http.status, you can filter on any of them directly — just press / and type the value.
You can also explore attributes visually: tab to the Attributes panel in the top-right, navigate with arrow keys, and press Enter on any attribute to see a modal with all its values and counts. This is particularly useful when you’re not sure what fields are in your logs and want to discover what’s available.
4. Go Fullscreen When You Need to Read
Press f to enter the fullscreen log viewer, a dedicated modal with full navigation support (Home/End, PgUp/PgDn, arrow keys) plus word wrapping via w. When you need to focus on reading a long log entry rather than watching charts, this is the mode to be in.
Recent Enhancements
Native Kubernetes Support
Gonzo now talks directly to the Kubernetes API — no more piping through Stern or kubectl. It auto-detects K8s attributes and surfaces Namespace and Pod columns automatically.
# All pods, all namespaces
gonzo --k8s-enabled=true

# Specific namespace + label selector
gonzo --k8s-enabled=true \
  --k8s-namespace=production \
  --k8s-selector="app=api"

# Multiple namespaces
gonzo --k8s-enabled=true \
  --k8s-namespace=production \
  --k8s-namespace=staging
Press Ctrl+k at any time to open an interactive filter modal where you can select and deselect namespaces and pods in real time. Changes apply instantly — no need to restart or re-pipe.
Severity Filtering (Ctrl+f)
Fine-grained control over which log levels are displayed, with real-time counts and color coding. Use Select All/None for quick toggling when you want to zero in on just errors, or clear out the noise entirely.
Log Viewer Wrapping
In the detailed log viewer, press w to toggle word wrapping. No more horizontal scrolling for long messages.
Skins and Theming
Gonzo ships with 11+ built-in themes, dark and light. Set one with --skin or in your config file:
gonzo --skin=nord
gonzo --skin=github-light
gonzo --skin=dracula
Available dark themes include default, dracula, gruvbox, monokai, nord, solarized-dark, and controltheory-dark. Light themes include github-light, solarized-light, vs-code-light, spring, and controltheory. You can also create your own with a simple YAML file in ~/.config/gonzo/skins/.
Integrations: Gonzo Works With Your Whole Stack
One of Gonzo’s strengths is that it works with virtually any log source. Here’s a quick rundown.
kubectl and Docker — pipe anything:
kubectl logs -f deployment/my-app | gonzo
docker logs -f my-container 2>&1 | gonzo
docker-compose logs -f | gonzo
K9s Plugin — add this to your K9s plugins config and press Ctrl+L on any pod or deployment to launch Gonzo directly:
plugins:
  gonzo:
    shortCut: Ctrl-L
    description: "Gonzo log analysis"
    scopes: [po, deploy, sts, ds, svc, job, cj]
    command: sh
    background: false
    args:
      - -c
      - "kubectl logs -f --tail=0 $RESOURCE_NAME/$NAME -n $NAMESPACE --context $CONTEXT | gonzo"
OpenTelemetry (OTLP) — Gonzo has a built-in OTLP receiver. Point your OTel Collector or app SDK at it and get a full log dashboard locally without deploying to an observability platform. This is a game-changer for local dev loops:
gonzo --otlp-enabled
# gRPC on :4317, HTTP on :4318
AWS CloudWatch:
aws logs tail "/aws/eks/stage/cluster" --follow --format json | gonzo
# Or use Live Tail for real-time streaming
aws logs start-live-tail --log-group-identifiers "arn:aws:logs:..." | gonzo
Grafana Loki via logcli:
logcli query --follow '{namespace="production"}' --output=jsonl | gonzo
Victoria Logs — native integration, no piping needed:
gonzo --vmlogs-url="http://localhost:9428" --vmlogs-query='level:error'
Vercel:
vercel logs <deployment_url_or_id> -j | gonzo --format=vercel-stream
For anything else, you can define a custom YAML format and parse virtually any log format Gonzo doesn’t cover natively.
What’s Coming Next
A few things in the works:
- More AI providers — abstracting the AI implementation to support a wider range of models and providers (shipping in v0.31)
- Web version — Gonzo in the browser
- More native integrations — Fly.io, Supabase, Cloudflare, and others on the list
- Built-in MCP server — get Gonzo insights directly in your AI-powered IDE
Get Involved
Gonzo is open source and the community is active. If there are integrations or features you’d like to see, we’d love to hear it.
- Docs: docs.controltheory.com
- GitHub: github.com/control-theory/gonzo
- Slack: Join the community
 Back
Back