Why High Cardinality Makes Datadog Costs Hard to Control
High-cardinality logs and telemetry don’t just drive up spend. They’re a signal that observability decisions are happening too late in your pipeline. Datadog high cardinality problems can be corrected without major surgery or loss of information.
This post explores why logs quietly dominate cardinality, why traditional controls fail, and how distillation reframes observability around system health. While this post uses Datadog as a concrete example, the same high-cardinality dynamics apply across modern observability stacks built on centralized log and telemetry pipelines.
What Is High Cardinality — and Why Does It Cost So Much?
In Datadog, cardinality refers to how many unique combinations of tags or attributes your telemetry data produces. The more dimensions you attach to a signal, the more unique time series, log fields, or trace attributes Datadog has to ingest, process, and store.
Consider a metric like api.request.count. On its own, it’s harmless. But tag it with env, region, user_id, and container_id, and you’ve suddenly created thousands — or even millions — of distinct time series. Each one is billed. Queries slow down. Dashboards lag. And most teams don’t notice the problem until Datadog costs spike.
Logs push this dynamic even further.
If every log line includes dynamic fields — request IDs, session tokens, payload fragments, headers — cardinality grows continuously and invisibly. Even if those fields are rarely queried, you’re still paying to ingest, process, and often index them. Over time, logs quietly become the largest and hardest-to-control source of Datadog spend.
Traces add yet another layer, capturing real-time request context across services and environments. Combined, logs, metrics, and traces create an observability pipeline where cardinality compounds faster than teams can react.
This is why high cardinality is so difficult to manage — and why traditional controls rarely feel effective.
Logs: The Silent Driver of Datadog High Cardinality
Logs are the backbone of observability — but they’re also the largest and least controlled source of cardinality in Datadog.
Unlike metrics or traces, logs are:
- Unstructured
- High-volume
- Rich in dynamic fields
Every log line can introduce new dimensions such as:
- Request IDs and trace IDs
- User IDs, session IDs, and tenant IDs
- Container, pod, node, and cluster identifiers
- File paths, URLs, and query parameters
- Feature flags, experiment variants, and rollout versions
- Error messages with embedded values
Log-based Upward Trend of the Datadog Cardinality Curve
At scale, this explodes fast. A single microservice emitting thousands of logs per minute, each with slightly different values can generate millions of unique field combinations per day. Once these fields are indexed or parsed, Datadog’s cardinality curve bends sharply upward, often without teams realizing it until the bill arrives.
What makes logs especially dangerous is that cardinality is accidental:
- A new deployment adds a field
- A debug statement sneaks into production
- A JSON payload includes a user-specific value
Why Traditional Log Pipelines Break Down
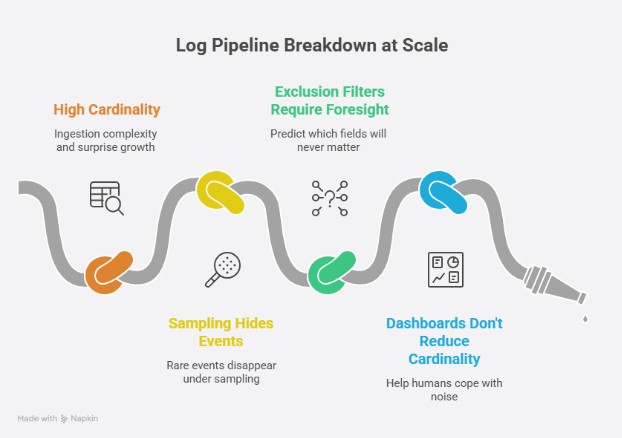
Most log pipelines were built on a simple assumption: collect everything first, decide what matters later.
That approach worked when systems were smaller and logs were sparse. At modern scale, it collapses under its own weight. The moment raw logs are centralized, cardinality is already baked in. From there, teams are left with a limited set of controls, all of them applied too late in the process:
- Indexing rules move the cost, not the problem
High-cardinality fields are still ingested, parsed, and processed before indexing decisions apply. You save on query flexibility, but not on ingestion complexity or surprise growth. - Sampling hides the rare events you actually care about
Incidents, regressions, and edge-case failures are statistically insignificant which makes them the first to disappear under sampling. - Exclusion filters require perfect foresight
Teams must predict which fields, services, or environments will never matter. In practice, the most expensive fields are often the ones you discover only after an incident. - Dashboards and alerts don’t reduce cardinality
They help humans cope with noise, but they don’t change the underlying shape of the data being ingested.
By the time logs reach Datadog, the system has already lost leverage. All that remains is damage control.
The Missing Layer: Distillation Before Centralization
High cardinality isn’t inevitable: it’s the result of where decisions are made in the observability pipeline. In other complex systems, raw inputs are never stored or analyzed directly. They’re distilled first — reduced, summarized, and shaped into signals that can be controlled over time.
Observability has historically skipped this step. Instead of transforming logs at the source, most pipelines forward raw events downstream and hope centralized tools can sort it out later. The result is a flood of unbounded context competing for attention, storage, and budget.
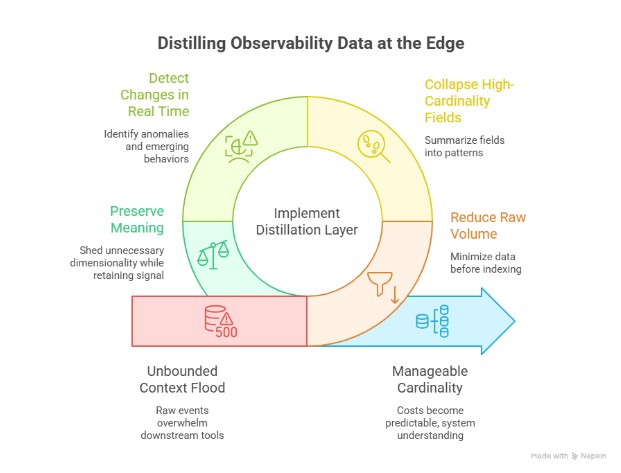
A distillation layer changes the equation:
- Reduce raw log volume before indexing and storage
- Collapse high-cardinality fields into patterns and summaries
- Detect changes, anomalies, and emerging behaviors in real time
- Preserve meaning while shedding unnecessary dimensionality
This isn’t about throwing data away. It’s about extracting signal early, while the system still has control.
When logs are distilled at the edge, close to where they’re generated, cardinality becomes manageable, costs become predictable, and observability shifts from data collection to system understanding.
From Cardinality to Health, Stress, and Hotspots
The real goal isn’t to tame cardinality for its own sake. It’s to understand the state of the system. When raw logs are distilled early, observability shifts from tracking millions of dimensions to monitoring health, stress, and emerging hotspots. Instead of reacting to cost spikes or drowning in log noise, teams can see when services are degrading, where pressure is building, and which behaviors are changing before they become incidents.
Dstl8 – Lower Datadog Cost & Upgrade System Health Visibility
Dstl8 applies this distillation layer at the edge, transforming high-cardinality logs into concise, correlated signals that reflect how systems are actually behaving. The result isn’t just lower Datadog spend — it’s a clearer, more controllable view of system health that scales with complexity. Cardinality becomes a symptom, not the problem, and observability becomes a tool for understanding rather than storage.
Learn about more Datadog optimizations here, including tail sampling traces and boosting AI SRE tools.

FAQs – High Cardinality in Datadog
Cardinality is a measure of uniqueness: how many distinct values (or distinct combinations of values) exist in a dataset. In observability, this becomes operationally relevant because unique label/tag combinations expand the number of time series or searchable groupings, which increases backend workload and, in some products, billable usage.
High cardinality describes a field or label set with a large number of distinct values, often approaching “unbounded” in production systems.
- High-cardinality data is diagnostically valuable but can stress traditional backends and cost models.
- Typical examples include user_id, request_id, trace_id, and full URLs with parameters.
- Metric cardinality increases as the number of distinct label combinations increases.
The most common high-cardinality offenders are attributes whose values are designed to be unique per request, user, or runtime instance.
- Request IDs and trace IDs.
- User IDs, session IDs, tenant/customer IDs.
- Container, pod, node, and cluster identifiers (especially in rapidly scaling environments).
- URLs with query parameters, file paths, and other near-infinite strings.
- Free-form error messages that embed variable values.
A distillation layer introduces an explicit transformation stage prior to centralization: instead of shipping raw logs downstream and attempting to manage them with late-stage controls, the system distills logs at or near the edge into structured signals, patterns, and summaries. This approach reduces unbounded dimensionality while preserving interpretability, which materially changes how predictable Datadog cost becomes under high cardinality pressure.
A defensible approach usually combines upstream shaping with deliberate use of Datadog’s log configuration primitives.
- Use Datadog’s separation of ingestion and indexing to index only what supports routine queries.
- Identify and normalize high-cardinality attributes (for example, strip query parameters, bucket IDs) before they enter indexing workflows.
- Route low-value or compliance-retention logs to archives rather than long retention in search-optimized tiers, then rehydrate selectively when needed.
- Set bounded rehydration scopes (time windows and query filters) to avoid rehydrating unnecessarily broad datasets.
- Monitor indexed-event consumption because indexed logs are billed monthly against commitments, with on-demand premiums for overage.
Datadog log rehydration captures log events from customer-owned archives and reintroduces them into Datadog’s search-optimized Log Explorer for analysis. Operationally, the important control is the “historical view,” which scopes rehydration using time windows and query filters so teams can retrieve only the subset required for a specific investigation.
Dstl8 continuously processes logs and converts high-cardinality, high-volume telemetry into operational signals that can be acted on earlier in the incident lifecycle. It can help you identify the “unknown unknowns” you never knew to look or query for ahead of time.
- Distills logs at the edge (close to where logs are generated) so the data shape is governed before downstream indexing and storage costs accumulate.
- Transforms high-cardinality logs into concise, correlated signals that reflect system behavior rather than raw event exhaust.
- Structures, cleans, and summarizes incoming logs to move analysis from query-driven filtering to context-driven understanding.
- Correlates patterns across services and clusters via Möbius’s operational inference layer, reducing the need for manual cross-dashboard correlation.
- Detects anomalies and surfaces incidents with always-on agents that investigate and explain what changed and why in plain language.
- Operates alongside Datadog by targeting “unknown unknowns” and emergent patterns that conventional dashboards and monitors do not capture by default.
The distinction is about how many distinct values a dimension can assume, which directly affects backend scaling and cost.
- Low cardinality: few repeated values (for example, env, region, status_code_class).
- High cardinality: many distinct values (for example, IDs and parameterized paths).
- Low-cardinality dimensions support stable aggregation and predictable dashboards.
- High-cardinality dimensions improve investigative precision but increase time series count and query complexity.
- Governance typically keeps low-cardinality dimensions for routine monitoring and restricts high-cardinality dimensions to targeted investigative workflows.
Table of Contents
Surface Unknown Unknowns Automatically
Catch emergent patterns from AI-generated code in staging—before they become production incidents.
Learn About Dstl8 Back
Backpress@controltheory.com