Logs are by far the most used telemetry signal, supposed to help us understand what’s happening in our systems and applications. But if you’ve ever tailed a massive stream of Kubernetes logs or piped JSON into grep, you’ve probably lived: endless noise, patterns hidden in plain sight, and a lot of wasted time.
That’s why we built Gonzo — an open-source terminal log viewer and log analysis TUI that brings the best of modern observability into the developer’s terminal. Inspired by K9s, but for logs, with built-in support for native OpenTelemetry/OTLP and even hooks for AI-powered analysis.
The Problem With Logs Today
- Too much hay, not enough needles: Most tools flood you with log data, leaving you to figure out what matters, and ironically don’t show you the “forest for the trees”.
- Fragmented workflows: You might jump between
kubectl logs, hosted log dashboards, and local JSON files. - Overhead of GUI tools: ELK, Loki and the like are powerful—but they’re heavy, require infra, and are overkill when you just want to debug quickly.
We wanted something different: lightweight, real-time, and designed to highlight patterns, anomalies, and trends—without requiring a cluster of servers just to get started.
What Makes Gonzo Different
Gonzo isn’t just another log tailer. It’s built from the ground up for real-time, interactive log analysis in the terminal:
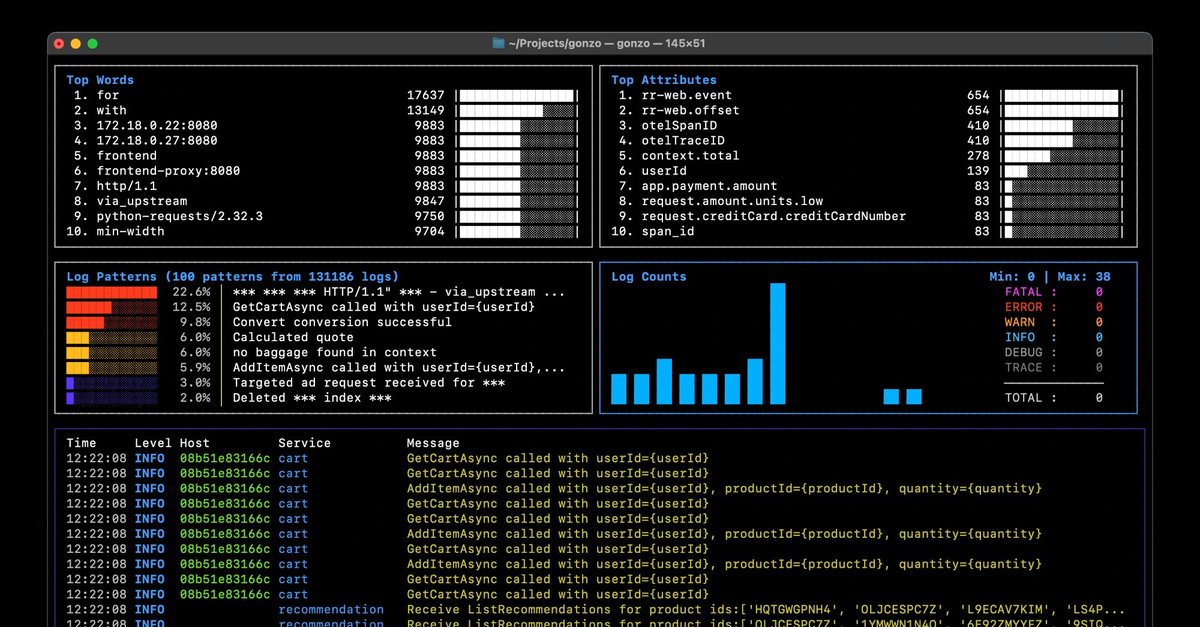
- 🎛 Terminal-first TUI — an intuitive interface that lets you fiilter, and search logs on the fly and boil up patterns and clusters
- 🔭 Native OpenTelemetry (OTLP) support — Gonzo speaks OTLP directly, so you can stream structured telemetry data without bolt-on hacks, super helpful for understanding log attributes, values and even cardinality.
- 🧠 AI-ready log analysis tool — Gonzo can pipe logs into a local LLM or a hosted model to summarize issues, identify anomalies, or explain cryptic errors (”PC LOAD LETTER” anyone? 😂)
- ⚡ Lightweight and fast — no servers, no dashboards, just immediate insights from your terminal.

Use Cases: Where Gonzo Shines
- Kubernetes troubleshooting: Stream pod logs and analyze them in a structured way.
- Local debugging: Point Gonzo at JSON log files or OTLP streams (e.g. from an OTel collector) and quickly spot error patterns.
- AI-powered insights: Let Gonzo’s AI hooks summarize cryptic errors into the three things you actually need to know.
- Team collaboration: Run Gonzo locally, or pair it with centralized telemetry pipelines (e.g. OTel collector) for shared observability workflows. Just the fast feedback loops you need to drive “observability driven development”.
Why We Built It
At ControlTheory, we spend a lot of time thinking about observability, OpenTelemetry, and the future of AI-driven SRE. What we kept running into was this gap:
- We had great dashboards for long-term observability.
- We had great Kubernetes tools for resources and metrics.
- But we didn’t have a fast, intuitive, terminal-native tool for logs that could scale with modern telemetry standards.
So, we built Gonzo.
Gonzo vs Alternatives
- K9s: Key inspiration for Gonzo – awesome for clusters, light on logs. Gonzo fills the log gap, especially when coupled with OTLP superpowers (telemetry attributes, resource attributes etc…). [🆕Gonzo now has K9s integration!]
- ELK/Datadog/Loki: Powerful at scale, but heavyweight and costly. Gonzo is lightweight and free.
- Traditional CLI tools:
tail,grep, andjqare potent tools—but they don’t proactively surface insights (e.g. patterns, heat maps) or integrate with AI. Gonzo does.
The Future of Gonzo
This is just the start. We’re working on:
- Smarter AI summarization for log bursts and groups.
- Richer filters and transformations for OTLP streams.
- Integrations with tracing and metrics to tie logs into full observability workflows.
Our goal is simple: help you see more needles, less haystack.
Try Gonzo Today
Gonzo is open source and ready to use.
-> Read the introduction on LinkedIn
If you’re looking for a terminal log viewer, a log analysis TUI, an OTLP log viewer, or even an AI log analysis tool—we built Gonzo for you.
Table of Contents
Surface Unknown Unknowns Automatically
Catch emergent patterns from AI-generated code in staging—before they become production incidents.
Learn About Dstl8 Back
Backpress@controltheory.com