The OpenTelemetry (OTel) Collector is a fundamental component of the OpenTelemetry architecture but can be a little complicated to sort through, especially when you add in important concepts like pipelines, receivers, processors, exporters, connectors, agents, and gateways. Let’s break it down piece by piece and clear up any confusion.
OpenTelemetry Collector
At the top level, the OpenTelemetry Collector simply receives telemetry, processes or filters it, then sends or exports it out to observability applications or other consumers. The Collector can receive telemetry signals – logs, metrics, traces, with more to come – from a wide variety of sources, integrating with existing instrumentation such as Datadog, Jaeger, and Prometheus or operating natively as its own collection agent. The Collector architecture is extensible, enabling it to support a broad range of existing or new sources or protocols in the future. For example, as OpenTelemetry embraces profiling as a new key signal type.

OpenTelemetry Collector Distributions
The OpenTelemetry Collector is available in multiple distributions. The core distribution includes only stable, officially supported components for minimal deployments. The contrib (OTel collector contrib) distribution adds community and vendor integrations for broader use cases. Vendors like AWS, Splunk, and Lightstep also offer custom distributions optimized for their platforms. Developers can additionally build custom collectors tailored to their needs using the Collector Builder.
OpenTelemetry Collector Builder
The Collector Builder is a tool for creating custom Collector binaries with only the components you need. It’s ideal for vendors or teams who want to reduce binary size, surface area, or include only vetted receivers/exporters. It uses a builder YAML config to specify included modules.
OpenTelemetry Collector Configuration Files
The Collector configuration file (or OTel collector config) is in YAML format, and defines all components that make up that specific Collector instance configuration, such as Receivers, Processors, Exporters, Pipelines and other optional components.
Collector Agent vs Gateway Deployment Pattern
There are two primary deployment patterns for the OpenTelemetry Collector: Agent and Gateway. The Agent deployment configuration is fairly common, as the agent simply runs as a daemon that can be independently deployed “close to the workload” (e.g. on the same host), similar to most instrumentation agents. In Kubernetes for example, the collector can be deployed as a daemonset where an instance of the collector is deployed to each node in the cluster.
In the Gateway deployment, the collector runs as a standalone service, collecting telemetry data from other agents before forwarding it. This can be useful for use cases such as load balancing or aggregation, and can also enable changes to telemetry flows without needing to make changes to the agents themselves.
OpenTelemetry Pipeline
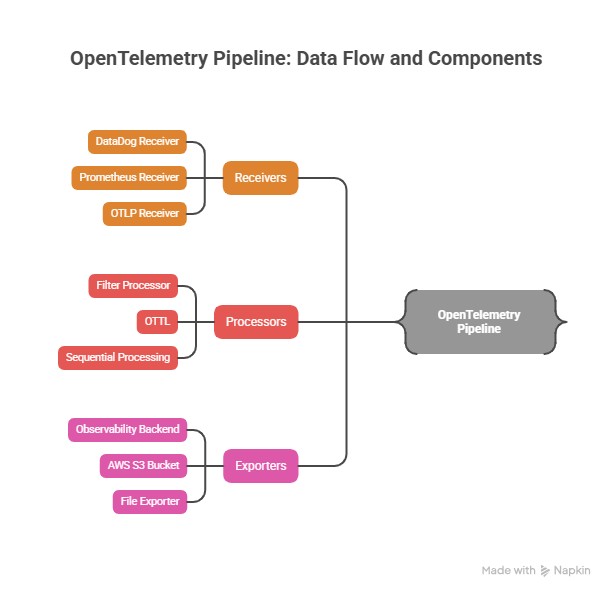
Inside each Collector, OpenTelemetry Pipelines define how data is received, processed, and exported. Each Collector can have one or more pipelines. This is particularly helpful when you, for example, want to split or filter data to different endpoints (e.g., some to your observability platform and some to AWS S3 storage).
A Pipeline consists of the following sub-components:
- Receivers
- Processors
- Exporters
Pipelines only operate on one kind of telemetry data type: traces, metrics, or logs, but you can have multiple pipelines for each telemetry type.
OpenTelemetry Receivers
Receivers are responsible for collecting the data. You may have one or more receivers for a pipeline. Receivers can receive data from your existing telemetry sources, for example via a DataDog receiver or a Prometheus receiver. For sources that natively support OpenTelemetry instrumentation, an OTLP (OpenTelemetry Protocol) receiver can be used. Some receivers (such as the OTLP receiver) support multiple signal types.
Prometheus Receiver vs OTLP
When ingesting metrics, you can either use the Prometheus receiver to scrape from endpoints or use the OTLP receiver to accept push-based metrics from instrumented apps. Prometheus scraping is great for infrastructure, while OTLP works well with OpenTelemetry-native SDKs.
OpenTelemetry Processors
Processors transform the received data, for example, to filter, enrich, sample, or in some way massage the data close to the source before moving it on. While they are optional, Processors are powerful components that enable much more control at the edge to avoid more expensive operations later or to improve the fidelity of the data sent so only the most important telemetry is exported out. As you can imagine, there are multiple ways to process data so there are multiple types of Processors available to manipulate and manage your observability data.
In a Filter Processor, OpenTelemetry Transformation Language (OTTL) defines the conditions for filtering or dropping telemetry. OTTL can be used for metrics, traces, or logs and is one of the superpowers of the OpenTelemetry Collector, as most of these signals are extremely redundant so filtering out the important telemetry from the massive majority of wasteful data is key.
Processors can be chained sequentially one after the other. The initial Processor gets the data from one or more receivers that are set up for the pipeline. The final Processor at the end of the chain operates, before the telemetry data is sent to one or more exporters as configured in the pipeline. The Processors work serially and transform the data at each step before forwarding it. This can include adding or removing attributes, dropping data or analyzing and creating new, more useful aggregate measurements.
OpenTelemetry Exporters
Exporters send the data out from the collector. There may also be multiple Exporters within a Pipeline. Exporters usually send the data they get to a management application (”observability backend”) but they can also write out to a debug endpoint, an AWS S3 bucket, a file and many other destinations. Some exporters (like the OTLP exporter) support multiple signal types.
OTLP (OpenTelemetry Protocol)
OTLP is the native wire protocol of OpenTelemetry, used to transmit traces, metrics, and logs between SDKs, Collectors, and backends. It supports both gRPC and HTTP/Protobuf formats. Most pipelines use OTLP receivers and exporters as the default way to exchange telemetry data between components.
OpenTelemetry Extensions
Extensions are optional components that provide capabilities on top of the primary functionality of the OTel collector. Common OTel Extension examples are for authentication or health checks.
OpenTelemetry Metrics
Metrics are a core signal type in OpenTelemetry. They can be pulled from endpoints using the prometheusreceiver, collected from system stats using the hostmetricsreceiver, or pushed via OTLP. Metrics pipelines help teams monitor system health, service performance, and custom business metrics.
OpenTelemetry Logs
OTel logs can now be processed natively through OpenTelemetry, commonly ingested using the filelog receiver. Logs can be parsed, filtered, enriched, or routed to destinations like Elasticsearch, Loki, or Amazon S3. OTel logs add critical context when combined with traces and metrics.
OpenTelemetry Traces
Traces are a foundational signal type in OpenTelemetry, representing the flow of a request as it travels through various services and systems. Each trace consists of spans, which capture timing and metadata for individual operations. Traces are typically collected using OTLP or Jaeger receivers.
OpenTelemetry supports both head-based and tail-based sampling, and offers processors like attributesprocessor, resourceprocessor, and tailsamplingprocessor to enrich or reduce trace data before export.
OpenTelemetry Connectors
An OpenTelemetry Connector is an optional component that joins two pipelines together. As such, it operates as both an exporter and receiver. When it first connects to a pipeline, it acts as an exporter at the end of that pipeline. To the connecting pipeline, it then acts as a receiver to send the data forward. Connectors can be useful for merging, (conditional) routing and replicating telemetry data across streams.
Sidecar Pattern – OpenTelemetry Collector in Kubernetes
In Kubernetes environments, the Collector can be deployed as a sidecar within the same pod as the application. This localizes telemetry collection for better performance and isolation, and is useful for traces and logs in particular. It complements other deployment patterns like daemonset or gateway.
Batch Processor
The batch processor buffers telemetry data and exports it in groups to improve throughput and reduce exporter load. It’s typically placed at the end of the processor chain. It’s considered a best practice in nearly every OpenTelemetry Collector pipeline.
OpenTelemetry Sampling
Sampling controls how much telemetry is collected and sent. There are two types:
- Head-based sampling: Occurs at the SDK level.
- Tail-based sampling: Happens within the Collector using the
tailsamplingprocessor, after spans are collected.
Tail-based sampling allows smarter decisions, such as keeping only slow or error-prone traces.
Open Agent Management Protocol (OpAMP)
Once you have a fleet of OpenTelemetry Collectors, their management becomes more complex. To eliminate proprietary vendor approaches to agent management, the Open Agent Management Protocol (OpAMP) was introduced to enable critical functions such as remote configuration, secure updates, health and internal telemetry, and security. The OpAMP server typically works in the “control plane” of the OpenTelemetry architecture, and provides the orchestration of the collector fleet agents at the data plane level. These agents act as OpAMP Clients providing a client-side implementation of the OpAMP protocol.
OpenTelemetry Control Plane
For cloud-scale architectures, it is essential to separate the data plane (the collectors and the telemetry flowing through them) and control plane (command and control) to maximize scalability, efficiency, security, and policy enforcement. The OpenTelemetry architecture consists of the OpAMP server at the control plane and OpAMP clients in the data plane (in the collectors). The separation of control planes and data planes has been an essential part of every successful cloud provider architecture, a foundational part of network design, and the basis for server, network, and storage virtualization.
OTTL
OTTL stands for OpenTelemetry Transformation Language. It’s a domain-specific language designed to simplify how users transform telemetry data (logs, metrics, traces) within the OpenTelemetry Collector.
Semantic Conventions
Semantic Conventions (also called semantic attributes) are standardized names for common operations and types of telemetry data — like HTTP requests, database queries, or messaging events.
By following these conventions, teams can ensure consistent naming across their codebase, libraries, and platforms. This makes it easier to analyze, correlate, and visualize telemetry — especially when working across multiple services or teams.
FAQs – Otel Collector Guide
OpenTelemetry (OTel) is an open, vendor-agnostic framework for producing and moving telemetry—primarily traces, metrics, and logs—through standardized protocols and conventions. In practice, teams instrument services with OTel SDKs and then rely on a downstream collection layer to receive, normalize, process, and export telemetry to one or more backends, minimizing the operational burden of maintaining multiple incompatible collectors.
- The OpenTelemetry Collector (often “otel collector”) is an executable that receives telemetry, optionally processes it, and exports it to one or more targets.
- It supports multiple signal types—metrics, logs, and traces—and can accept data from non-OTel sources (e.g., Prometheus- or Jaeger-shaped inputs).
- It is intentionally extensible, so receivers/exporters can be added to support additional formats and destinations.
- Operationally, teams adopt it to centralize policy (filtering, sampling, enrichment) “near the source,” rather than pushing these concerns into every application.
- A pipeline defines the path telemetry follows: reception, optional processing, then export.
- Accordingly, each pipeline is composed of receivers, processors, and exporters.
- Pipelines are signal-typed: a pipeline operates on traces, metrics, or logs (you can define multiple pipelines per signal).
- A single receiver can feed multiple pipelines, and pipelines can fan out to multiple exporters.
An OTel Collector configuration is a YAML document that specifies which receivers, processors, exporters, and pipelines are active in a particular deployment. It is also where operators attach optional extensions (for example, health checking or authentication) and define how telemetry should be routed across one or more destinations. In effect, the YAML is the operational contract for the collector application in that environment.
- Prometheus is an open-source monitoring system centered on a time series database and a dimensional metrics model.
- It commonly uses a pull (scrape) approach to collect metrics from targets.
- The OpenTelemetry Collector can interoperate with Prometheus-oriented environments by using a Prometheus receiver to scrape endpoints.
- This interop is useful when some systems are Prometheus-native while newer services emit otel metrics via OTLP.
Processors are the Collector’s mechanism for policy enforcement on telemetry streams: they can enrich signals with attributes, redact or drop data, and apply sampling or transformation logic before export.
OTTL provides a declarative language for expressing filtering and transformation conditions across logs, metrics, and traces, which is particularly relevant because many telemetry streams contain substantial redundancy when left ungoverned.
- Exporters send telemetry out of the collector to a destination, typically an observability backend.
- Exporters may also write to local/debug outputs (e.g., debug exporter) or durable storage targets (e.g., file or object storage).
- “Open collector output” is best understood as fan-out routing: the same processed signal can be exported to multiple destinations.
- OTLP exporters are often used as the default interoperability mechanism between collectors and backends.
Sampling in OpenTelemetry is implemented either at the head (in the SDK) or at the tail (in the Collector). Tail-based sampling is performed after spans are collected, which allows the collector to make more informed retention decisions—such as preserving traces with errors or high latency—rather than sampling blindly at the point of creation.
- A connector joins two pipelines and functions as both an exporter and a receiver.
- It supports deliberate pipeline composition (for example, transforming once and then routing to multiple downstream policies).
- Connectors are useful when duplicated exporter configurations would obscure the intended dataflow.
- They can simplify reasoning about telemetry pathways in complex collector deployments.
- In documentation terms, connectors encourage explicit modeling of intermediate stages rather than implicit fan-out.
- This tends to improve maintainability when routing or transformation requirements evolve.
Extensions are optional OTel Collector components that add operational capabilities beyond the receiver–processor–exporter path. Health check extensions support basic service supervision, while authentication-related extensions help regulate access to receivers and administrative endpoints. In production deployments—especially those installed via Helm—default endpoint binding and access controls are frequently treated as security-relevant configuration, which is where extensions often become operationally material.
Table of Contents
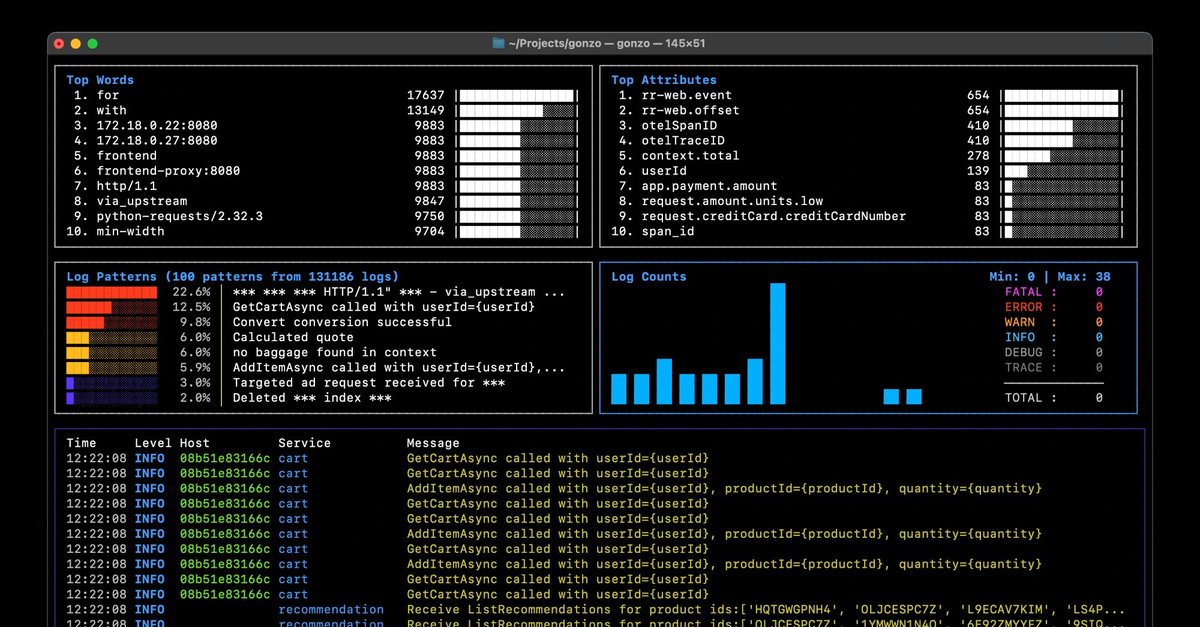
Logs. Understood. Instantly.
Analyze logs directly in your terminal with real-time insights and AI-powered pattern detection—no dashboards, no friction.
Get Gonzo Back
Backpress@controltheory.com