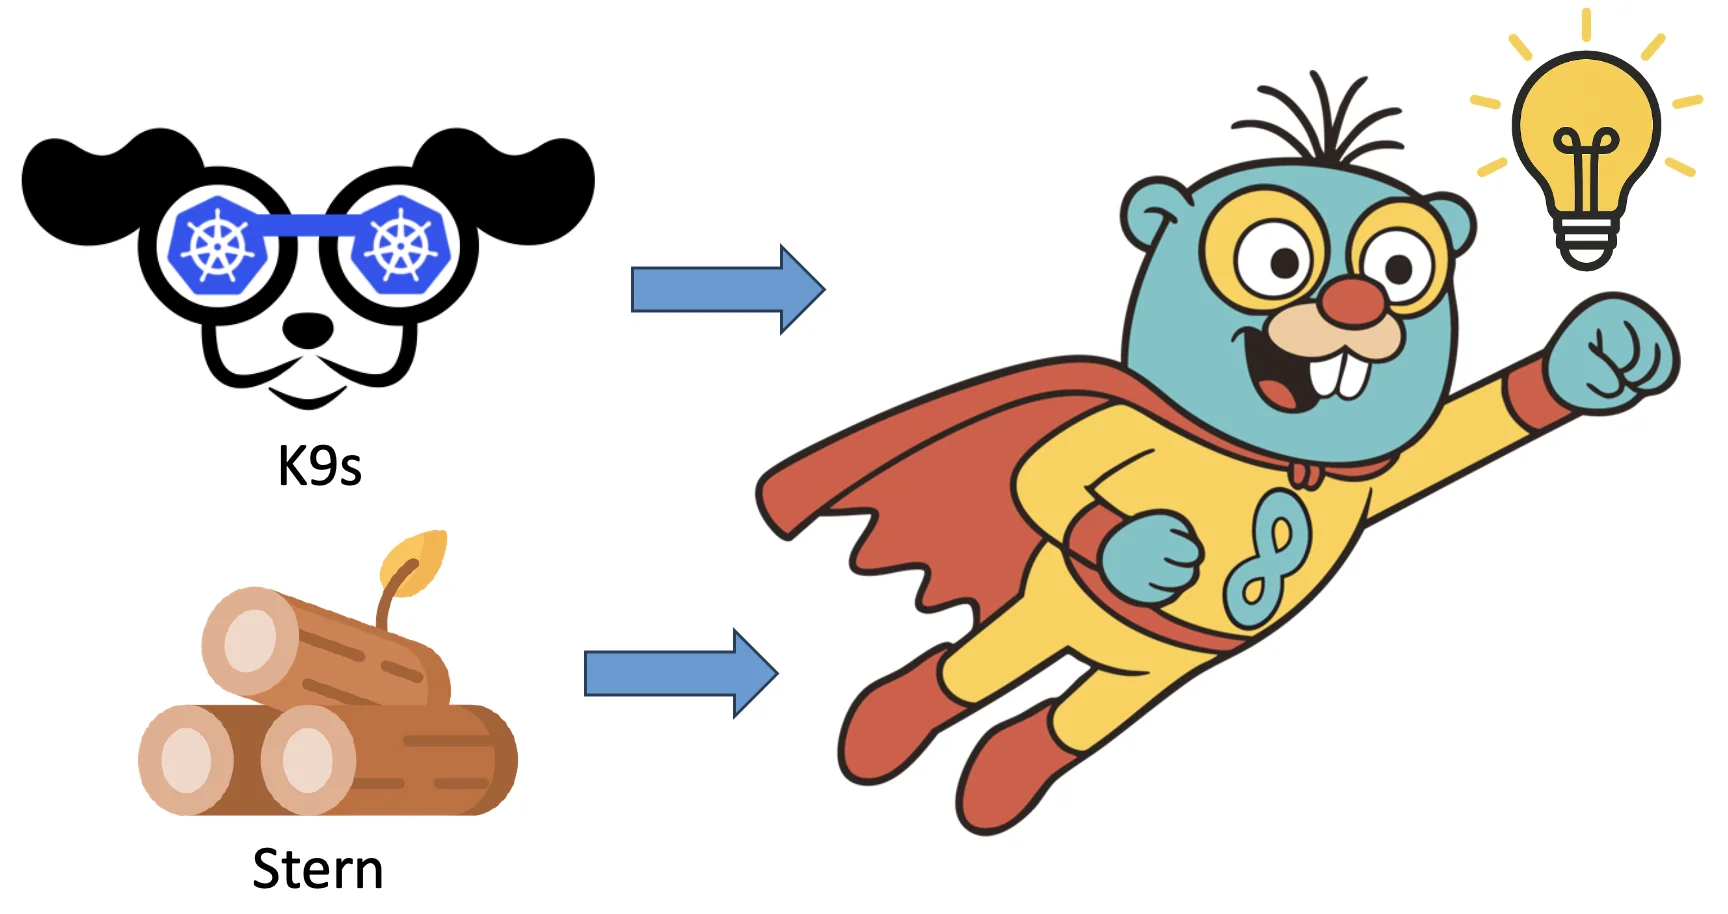
Kubernetes engineers love K9s for fast, keyboard-driven cluster navigation and Stern for flexible, multi-pod log tails. Gonzo adds a third superpower: a terminal UI that turns raw log streams into live charts, pattern extraction, and AI-assisted insights—without leaving your terminal.
This post shows two quick ways to bolt Gonzo onto the tools you already use:
- A K9s plugin so you can highlight a pod and pop straight into Gonzo’s live view.
- A Stern → Gonzo pipeline that analyzes multi-pod/label-based log tails in real time (JSON output).
Why layer Gonzo on top?
- Real-time analysis, not just text: severity distribution, word frequency, service breakdowns, and a heatmap to reveal bursts and patterns at a glance.
- Plug-and-play input: stdin from
kubectl logs,Stern, files, Docker logs—plus native OTLP support. - Keyboard-first UX (Vim-style) with mouse support; it’ll feel familiar if you live in K9s.
- Optional AI help with OpenAI, LM Studio, or Ollama for pattern explanations and summaries.
Prereqs (quick install)
Gonzo
brew install gonzo
# or
go install github.com/control-theory/gonzo/cmd/gonzo@latestStern
brew install stern
# or
go install github.com/stern/stern@latestK9s
 # Via Homebrew
brew install derailed/k9s/k9sOption 1 — One-key K9s → Gonzo plugin
Add a plugin so K9s streams the selected pod’s logs into Gonzo with a single keystroke.
Create (or edit) ~/.config/k9s/plugins.yaml and add:
plugins:
  gonzo:
    shortCut: Ctrl-L
    description: "Gonzo log analysis"
    scopes:
      - po
    command: sh
    background: false
    args:
      - -c
- "kubectl logs -f $NAME -n $NAMESPACE --context $CONTEXT | gonzo"How it works:
- Open K9s, go to Pods
- Highlight a pod, press Ctrl-L
- Gonzo launches and starts a live analysis dashboard on that pod’s stream
K9s plugin locations and env vars (like $NAME, $NAMESPACE, $CONTEXT) are documented here.
Tip: on macOS, setting XDG_CONFIG_HOME=~/.config keeps paths consistent with Linux.
Option 2 — Stern → Gonzo for multi-pod, label-based log tails
Stern excels at “grab a whole slice of the cluster” with label selectors, namespaces, container filters—and it can emit clean JSON that Gonzo ingests perfectly. Use the -o json format for analysis.
Stern flags you’ll use most:
- Select by label: –
l app=my-api - Span all namespaces: –
A - Time window: –
s 5m - Output format: –
o json(recommended so that Gonzo picks up the log attributes)
Recommended pipelines (JSON)
1) Structured app tail (single namespace)
stern -n prod -l app=my-api -o json | gonzo2) Cross-namespace incident sweep
stern . --all-namespaces --output json | gonzo3) Focus on one namespace (last hour)
stern . -n production --since 1h --output json | gonzoGonzo tips while tailing
- Search & filter: press
/for regex filter,sto search/highlight. - Fullscreen logs: press
ffor a dedicated viewer with smart auto-scroll and page nav. - Log Counts modal: press Enter on to see a heatmap, pattern analysis by severity, and service distribution.
- AI assist: press
iin the log detail modal to ask your configured model about selected logs/patterns.
When to use which path?
- Already in K9s, drilling into a single pod → use the K9s plugin for a one-keystroke jump into analysis.
- Need a fleet tail (by label/namespace) with structure → use Stern → Gonzo with
-o json.
Troubleshooting
- Gonzo shows plain text instead of fields (attributes) – Double-check Stern is emitting JSON: add
-o json. Gonzo parses one-object-per-line JSON (JSONL). - macOS plugin path confusion – Set
XDG_CONFIG_HOME=~/.configso K9s findsplugins.yamlat~/.config/k9s/plugins.yaml. - Multi-namespace fan-out feels heavy – Tune Stern concurrency with
--max-log-requestsor bound the time window with-s 5m.
Wrap-up
You don’t have to choose between K9s, Stern, and Gonzo. Use K9s to navigate, Stern to capture the right slice of logs, and Gonzo to see the story inside that stream—spikes, patterns, and the outliers that cause incidents. It’s the fastest way to go from “something’s off” to “I know where to look next.”
Table of Contents
Surface Unknown Unknowns Automatically
Catch emergent patterns from AI-generated code in staging—before they become production incidents.
 Back
Backpress@controltheory.com