In this blog, we’re going to take a look at how Gonzo can be leveraged to troubleshoot and get to the bottom of what’s happening for a real scenario in the OTel demo application, for logs that might be coming from multiple sources. Follow along in the video!
The Setup
We can set this scenario up on a simple Kind cluster on our laptop, and install the OpenTelemetry demo micro-services application following the instructions here.
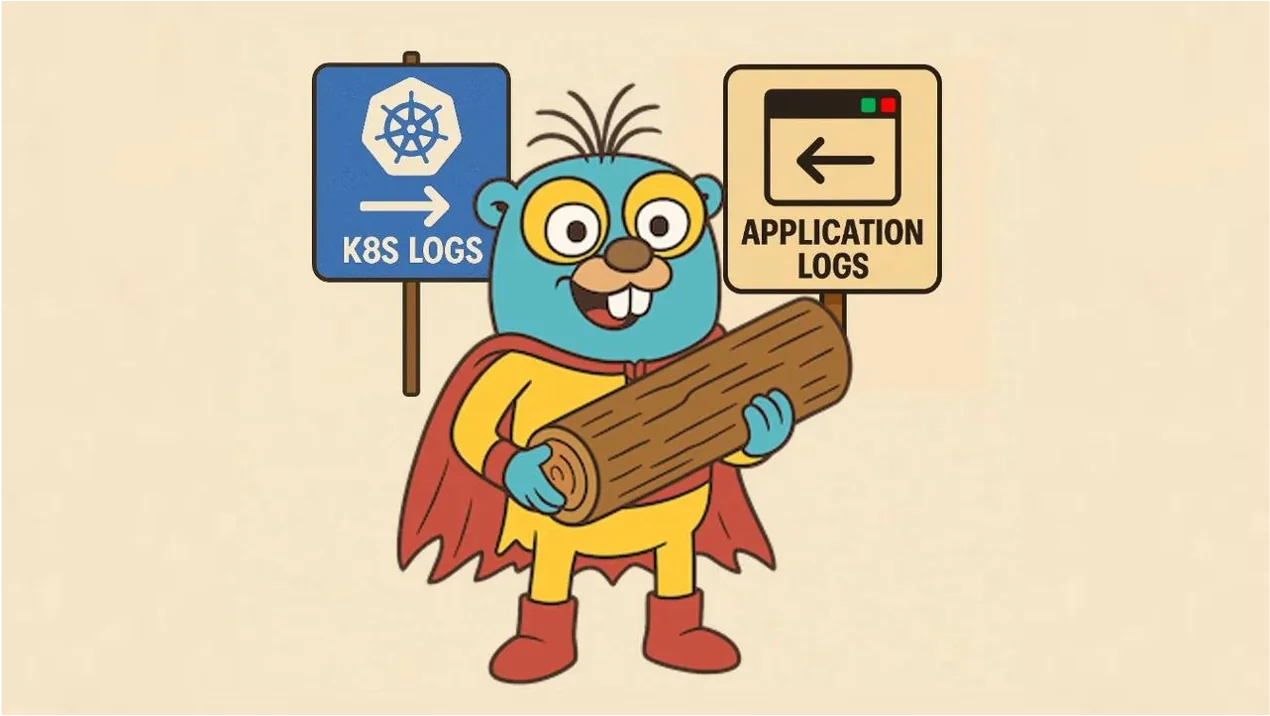
To gather logs for Gonzo to work from, we’re going to leverage the OTel collector as documented in our previous blog here. Note that there are two sources of logs here (and hence a tale of two log types!):
- Application Logs coming from our pods/containers (via the filelogs receiver)
- Kubernetes API events (coming from the k8sobjects receiver)
This allows us to understand both what is happening “inside” our application, and key events coming from the k8s infrastructure itself.
Recall that in addition to being able to ingest JSON and text logs, Gonzo can also function as an OTLP receiver and then be configured to receive (both types of) logs from your deployed OTel collector(s) – for example, you could hop onto a host running a Gateway collector and forward logs via OTLP to Gonzo, for local quick and easy troubleshooting.
The Scenario
Ever configured your k8s pods or deployments to use the wrong image? Yep – me too ✋ That’s basically what we’re going to do here. We’ve been moving our compute to leverage ARM machines for price/performance benefits, but we hooked up the wrong image when we just deployed a new version of the “checkout” service in this case. Pretty easy to repro and a nice test – you can accomplish this pretty simply on your running OTel demo app, for example, by patching the checkout deployment with a fake (non existent) image like:
kubectl patch deploy/checkout \
  -p '{"spec":{"template":{"spec":{"containers":[{"name":"checkout","image":"registry/arm:tag"}]}}}}'
Follow Along – The Easy Button
We ran the scenario so you don’t have to! We ran the OTel demo for a couple of minutes before and after the bad image deployment to the checkout service and captured the resulting logs from both log sources in the attached file bad_image_deploy.json
Once you’ve installed Gonzo, you can see the resulting scenario in Gonzo quickly by running cat bad_image_deploy.json | gonzo -b 10000 – setting the buffer to 10000 with (-b) here allows you to keep all the logs from the scenario in your buffer. You could also stream the logs over time if you prefer for a more realistic scenario with a simple shell script similar to:
#!/bin/bash
# Save this as slowcat.sh, chmod +x slowcat.sh
delay=0.1   # seconds per line
while IFS= read -r line; do
  echo "$line"
  sleep "$delay"
done < "${1:-/dev/stdin}"
and then run ./slowcat.sh bad_image_deploy.json | gonzo -b 10000
Gonzo In Action
1. The Patterns
It’s sort of ironic but when we’re trying to find the needle in the haystack in our logs, we first need to see the forrest for the trees! (see what I did there?) The top panels in Gonzo are there to help you find patterns, whether that’s by common words, phrases in the log body or groupings (log counts) by severity. The attributes in the top right can also be very handy (with OTel sources) to identify the top attributes (or resource attributes) attached to your logs, and which ones are driving the most values i.e. cardinality.
In our scenario, we don’t see anything obvious in the “Top Words” so we drill into the “Log Counts” chart which gives us a nice heat map of severity over time, and top log patterns and service by log severity – there’s some ERRORs and WARNs on the observability infra itself (OTel collector, Prometheus – been meaning to fix those!) – but nothing obvious on our application itself.
Jumping back to the home screen, a quick review of “Top Patterns” coming from the log bodies catches our eye – with a Failed to load resource... message boiling to the top. This is a good lead and we proceed to the (regex) filter….
2. The Filters
We hit / to enter our filter – something like Failed|failed|Error|error|ERROR – (my regex isn’t that great!), and in addition to the “Failed” text we saw above, we throw some Errors in the filter for good measure! We quickly filter to the logs in the bottom panel containing those strings. Ignoring our OTel collector errors, we can see a bunch of “Failed to load resource…” INFO logs coming from the Load Generator service, which talks to the Front End to generate load for the OTel demo – a good reminder that logs are not always necessarily categorized well, particularly those middleware or 3rd party libraries that we may not have control over. We then see a WARN log, with no specific service field populated (hint: it’s coming from the K8s API) starting kvlist_value:. We can hit Enter to drill into the details of that log message.
3. The AI
We can see now from the attributes section that this log is coming from k8s.resource.name=events so we know that this log is coming from the K8s API. It’s kind of hard to read the log body here and it’s basically a big list of key, value pairs. No worries – we can send it to an LLM pretty quickly – either a hosted model, or one we have running locally on our machine, so log data never has to leave our environment. We get a message back with a pretty clear conclusion – basically a failed image pull on the checkout service, and we can see immediately the incorrect image specified from the log message and the AI summary.
The Conclusion
We specified the incorrect image in our routine update of the checkout service, which led to a number of logs coming from the K8s API on the checkout service (pods) itself, as well as observing upstream application errors on the load generation service. Logs are great to drive this kind of troubleshooting and RCA, but they are notoriously noisy. By surfacing patterns, Gonzo, helps separate the wheat from the chaff, provide areas to hone in on, while filters allow you to do that quickly, with AI support for explanation and follow up.
What’s Next?
See if you can follow along by using Gonzo with the sample log file above from the scenario, or check out the video. Other scenarios or integrations you’d like to see? – drop us a line!
Table of Contents
Surface Unknown Unknowns Automatically
Catch emergent patterns from AI-generated code in staging—before they become production incidents.
Learn About Dstl8 Back
Backpress@controltheory.com