In a previous blog, we reviewed how to install the OpenTelemetry (OTel) Collector locally, in place of the DataDog agent to be able to receive (custom) metrics and traces instrumented with the DataDog ddtrace client. In this blog, we’ll review step-by-step how to receive metrics, traces and logs from an existing DataDog agent using various methods. This can be a less disruptive approach, but still allow you to analyze and optimize your existing DataDog telemetry, before sending it to DataDog or another destination.
Using an Existing DataDog Agent (Metrics and Traces)
You can collect information from the DataDog agent in a couple of modes – a good way to start is by leveraging “dual shipping”, where the DataDog agent can continue to send data to the existing DataDog (cloud) backend, but also be configured to send a copy of the telemetry to a collector, where it can be analyzed and optimized without affecting what is currently being sent to DataDog.

Using “dual shipping” with the DataDog Receiver
Recall that the DataDog Receiver is a receiver or source in the contrib OTel collector distribution that can be used to receive both metrics and traces from an existing DataDog installation. To support dual shipping of metrics and traces, you will need to configure a DataDog source/receiver in your collector, and configure the additional shipping destination on the DataDog agent.
Configure the DataDog Source/Receiver in Your Collector
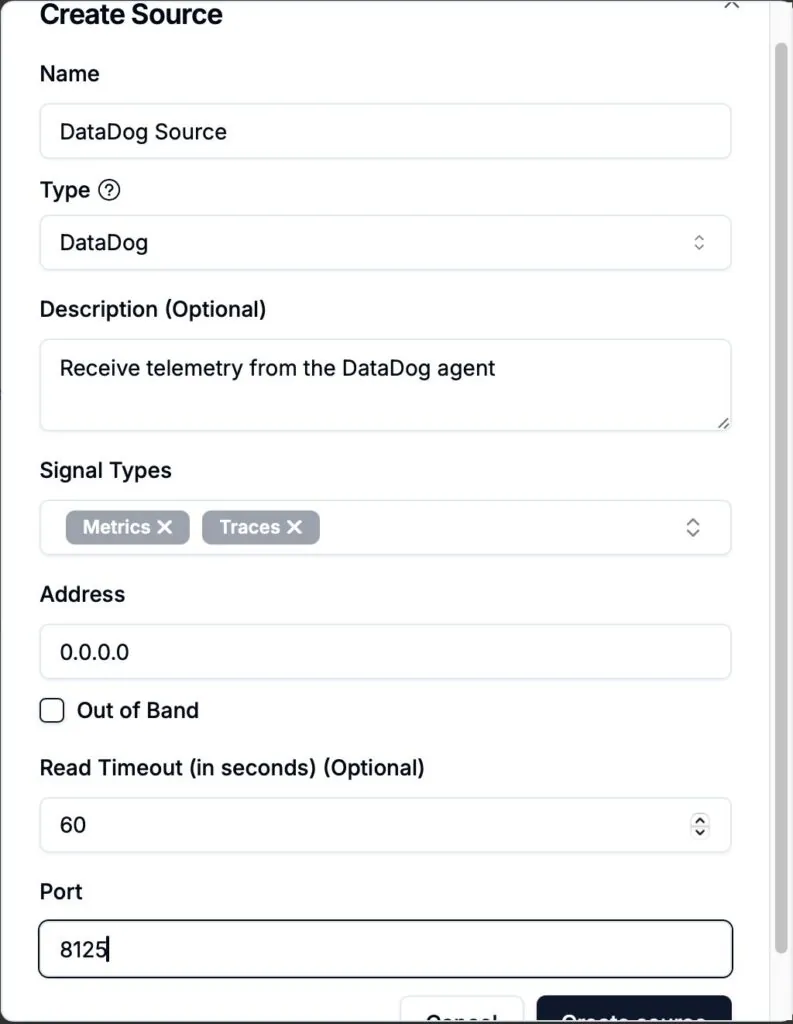
To create a source/receiver inside of ControlTheory, navigate to “Sources” in the left hand navigation and create a new source for DataDog. Configure the endpoint the receiver should listent on (e.g. 0.0.0.0 or localhost) and the port (note that the DataDog receiver uses port 8126 by default which is the same as the DataDog agent default port, so you may want to change this to something different like 8125).
You can then include the DataDog source in a (metrics or traces) pipeline and configuration and apply that to a collector/agent – for “dual shipping” you could send this telemetry to a NOP (dev/null) destination for example to get started and analyze the traffic coming from DataDog.
Configure Dual Shipping on the DataDog Agent
You can set an additional endpoint in your DataDog agent by setting an environment variable:
DD_ADDITIONAL_ENDPOINTS='{"http://<DATADOG_RECEIVER_HOST>:<DATADOG_RECEIVER_PORT>": ["CT"]}'OR by updating the agent configuration file:
additional_endpoints: http://<DATADOG_RECEIVER_HOST>:<DATADOG_RECEIVER_PORT>Where <DATADOG_RECEIVER_HOST> and <DATADOG_RECEIVER_PORT> are the endpoint and port you exposed in your DataDog source/receiver previously.
The above configuration is sufficient for forwarding DataDog metrics, for traces the following additional (APM) environment variables should be set on the DataDog agent:
DD_APM_ENABLED="true"
DD_APM_RECEIVER_PORT="8126"
DD_APM_NON_LOCAL_TRAFFIC="true"
DD_APM_ADDITIONAL_ENDPOINTS='{"http://<DATADOG_RECEIVER_HOST>:<DATADOG_RECEIVER_PORT>": ["CT"]}'You will need to restart the DataDog agent for the changes to take effect.
Disabling “dual shipping” (or sending only to the collector)
Once you are comfortable with the telemetry flowing through the collector from the previous step, and any optimizations (processors) that you may have applied, you can set up your pipelines to send to a DataDog destination if desired (see below), and you may disable the dual shipping configuration on the DataDog agent so that it only sends telemetry data to the collector. This way, any optmizations you have defined (e.g. filtering etc…) will be applied before the data is sent to the DataDog backend.
This will send telemetry from the DataDog agent to the collector only
Configure the DataDog Agent
Configure the agent environment variable:
DD_DD_URL='{"http://<DATADOG_RECEIVER_HOST>:<DATADOG_RECEIVER_PORT>": ["CT"]}'OR update the agent configuration:
dd_url: http://<DATADOG_RECEIVER_HOST>:<DATADOG_RECEIVER_PORT>Where <DATADOG_RECEIVER_HOST>and <DATADOG_RECEIVER_PORT>are the endpoint and port you exposed in your DataDog source/receiver.
You will need to restart the DataDog agent for the changes to take effect.
Logs – Using an Existing DataDog Agent
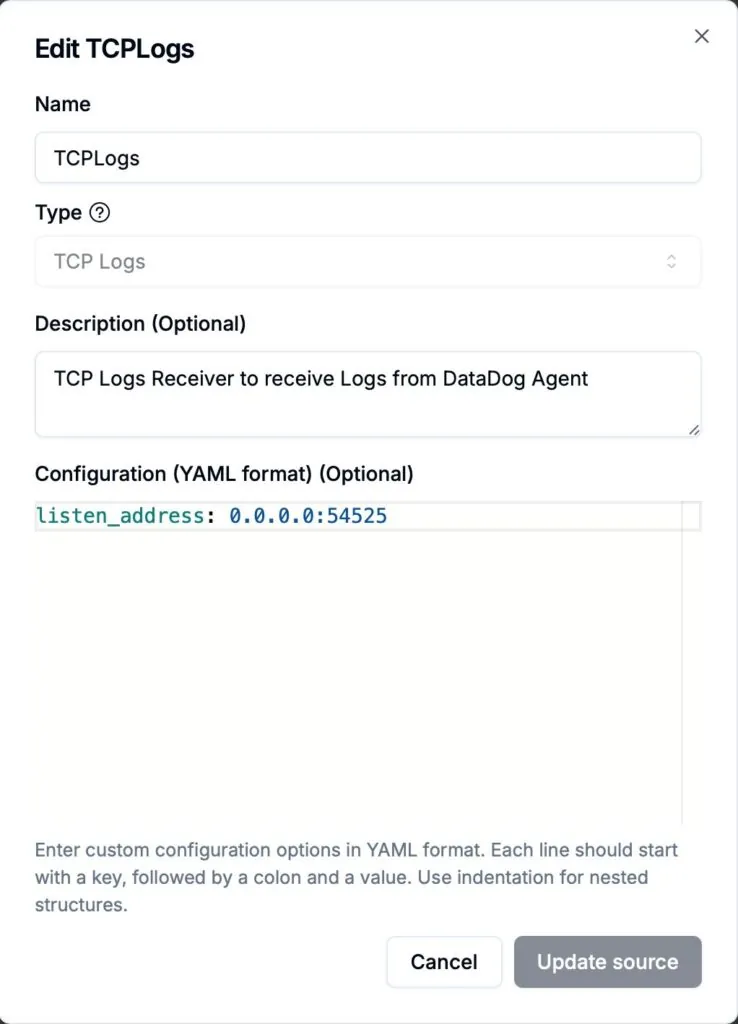
For metrics and traces, we leveraged the DataDog receiver, which does not support logs currently. For logs, we can leverage a different receiver in our collector pipelines and configuration. In this particular configuration, you can use the DataDog agent to send logs to the collector only (no dual shipping), by using a TCP proxy configuration. You can then send the logs on to the DataDog backend using the DataDog destination/exporter (below). To receive the TCP logs in the collector, you can configure a TCP source/receiver, for example listening on port 54525:
You can then configure the following environment variables in your DataDog agent for logging:
DD_LOGS_ENABLED=true
DD_LOGS_CONFIG_LOGS_NO_SSL=true
DD_LOGS_CONFIG_LOGS_DD_URL="<TCPLOGS_RECEIVER_HOST>:<TCPLOGS_RECEIVER_PORT>"Where <TCPLOGS_RECEIVER_HOST>and <TCPLOGS_RECEIVER_PORT>are the endpoint and port you exposed in your TCPLogs source/receiver. OR you can update the agent configuration with:
logs_enabled: true

logs_config:
  use_ssl: false
logs_dd_url: "<TCPLOGS_RECEIVER_HOST>:<TCPLOGS_RECEIVER_PORT>"DataDog as a Destination (Metrics, Traces, Logs)
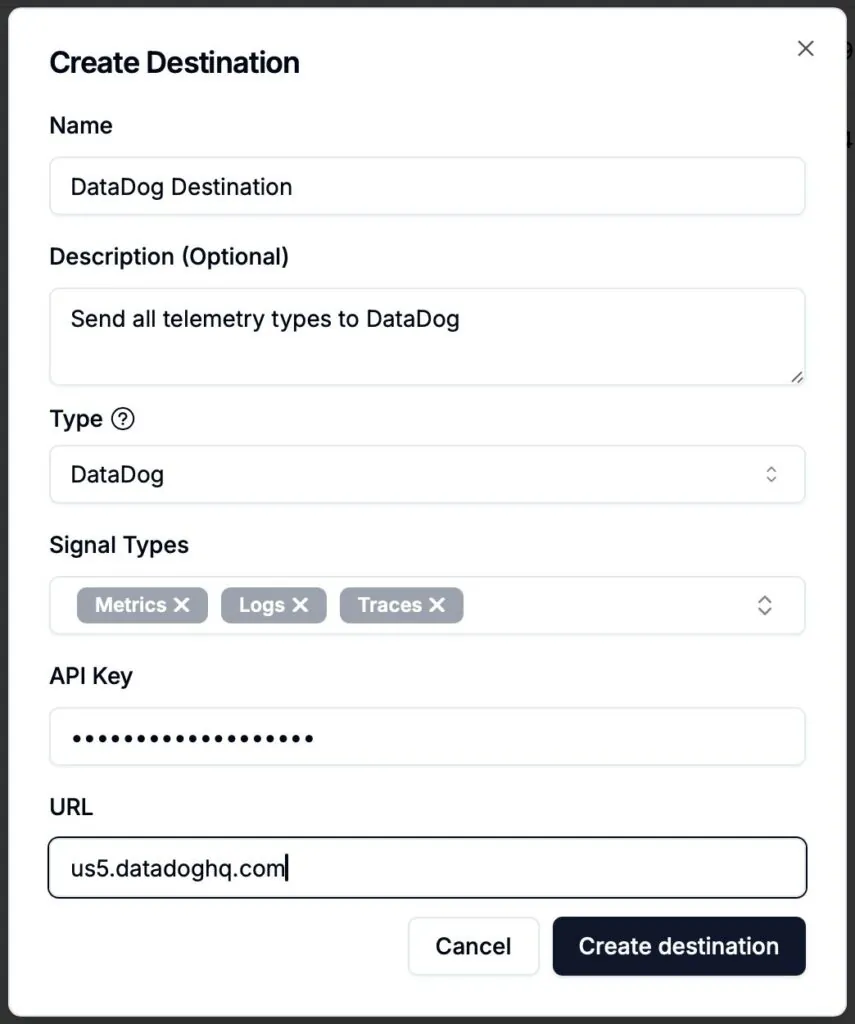
Sending your telemetry data to DataDog as a destination for all signal types is straightforward using the DataDog exporter. You may add DataDog as a destination in ControlTheory by navigating to “Destinations” in the left hand navigation and selecting the “DataDog” destination type. You will then be prompted for your DataDog URL (e.g. “us5.datadoghq.com“) and API key. Once created, this destination can then be leveraged in your pipelines and configurations.
Summary
In this walkthrough, we stepped through how to receive metrics, traces, and logs from an existing DataDog agent using the OpenTelemetry (OTel) Collector—without fully replacing your current setup. By leveraging “dual shipping” (for metrics and traces), you can forward telemetry data to both a DataDog backend and a collector simultaneously, allowing you to analyze, filter, and test optimization of your observability data in ControlTheory before switching to a single shipping or “in-line” configuration. We cover step-by-step configuration for both metrics/traces via the DataDog receiver and logs via a TCP proxy using the TCPLogs receiver, and also show how to route optimized telemetry back to DataDog using the DataDog destination/exporter. This approach enables a smooth, low-risk migration path toward more flexible and cost-effective observability.
Table of Contents
Logs. Understood. Instantly.
Analyze logs directly in your terminal with real-time insights and AI-powered pattern detection—no dashboards, no friction.
 Back
Backpress@controltheory.com