“Cardinality” is one of those words you come across in the observability and monitoring space that seems to be bandied about a lot these days. Basically a fancy word for the number of items in a set or the permutations of values for an attribute, it can send shivers down an observability engineer or SRE’s spine. And one big reason for that is cost – because many observability and monitoring vendors charge by the number of unique time series / metrics ingested (also sometimes known as “custom metrics”), and every combination of a metric’s name and associated tag values is considered a unique time series that is charged for. The classic example is metric cardinality (and oftentimes DataDog metric cardinality) – for example, storing a metric with a tag of user_id where the value of that tag could obviously be a wide range of things (users), but throw in some additional tags (or even the host tag) and you’ve got a boatload of potential combinations. In this blog, we’ll look at some simple ways we can reduce the cardinality of our metrics using a simple filtering approach.
Custom Metrics – Simple, Powerful, Expensive….
Due credit to vendors in this space – they’ve made it simple for developers to instrument their applications for key business metrics (or “custom metrics”), which is exactly what we want! We want our development and engineering teams to be putting measures in our code that impact our business after all – that’s sort of the point! But it’s unreasonable for developers to have to understand a given observability vendor’s (often very complex) pricing model, and anticipate all of the potential permutations of a given measure or metric up front. Astute SRE or DevOps teams may actively monitor the number of (custom) metrics in some homegrown dashboards and alerts (and even then there may have been a cost already to ingest the thing), but for many customers, they find out about this “cardinality explosion” after the fact in their bill. To be clear, this can happen wherever we have metrics, that can be DataDog Metric Cardinality, New Relic, Dynatrace, heck it could even be blowing up the storage (and compute) in our locally hosted Prometheus. This quote from Reddit pretty much sums it up:
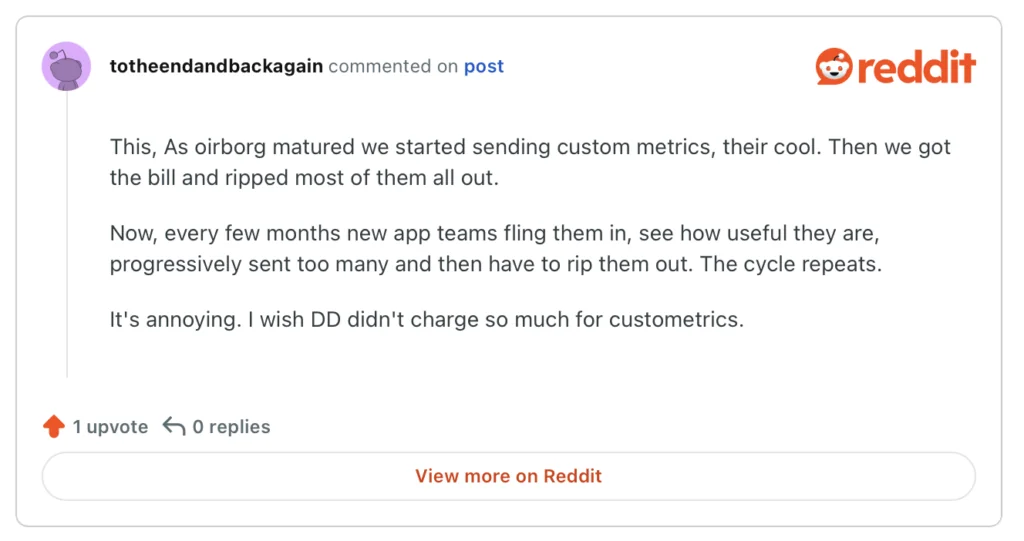
And it’s not just the cost of the bill (DataDog Metric Cardinality in the case above) – the continuous interaction here from finance to engineering to dev and back again is extremely inefficient – what I have come to call the “Goldilocks problem” – of getting just the right amount of instrumentation, not too hot or too cold but just right! Many times, the costly instrumentation will just stay in place because of the opportunity cost of moving a dev away from what they’re working on, to quote a recent customer conversation:
“To implement this thing to remove some of the instrumentation. Not all of it. Just let’s get rid of some, and so…then it becomes an it just doesn’t get done, because again, of the opportunity cost. It’s like, well, it’s just cheaper just to not have them taken off of that feature.”
And the cycle repeats…..
Metrics, Metrics (and Metric Cardinality) Everywhere……
But what if we could monitor, analyze and control this onslaught of high cardinality metrics? Turns out we can, by passing our emitted telemetry through one or more OTel collectors – we have the capability to control the telemetry before it reaches our observability vendors and backends, and before it racks up the bill….
While there are quite a number of clever ways to control cardinality (looking at you aggregation) – filtering is a pretty simple way to get things under control. And simple is good. Furthermore, we’ve worked with customers who are saving well into the 6 figures and up annually, just on the metrics portion of their bill alone by using this approach.
Playground – Testing Our Metric Cardinality Reduction Filters
For this exercise, we’ll use the “OTTL Playground” a browser based tool you can try here – kindly created by the folks at Elastic – allowing you to currently test expressions for the filter processor and the transform processor – all from with your browser – pretty cool! “OTTL” is short for “OpenTelemetry Transformation Language” and is a domain specific language that can be leveraged for example in the OTel collector filter processor or transform processor.
Navigating to the tool, you can select the Filter processor in the top right, and then select “Drop specific metric and payload” which will give us a sample OTLP metrics (JSON) payload that we can experiment with.
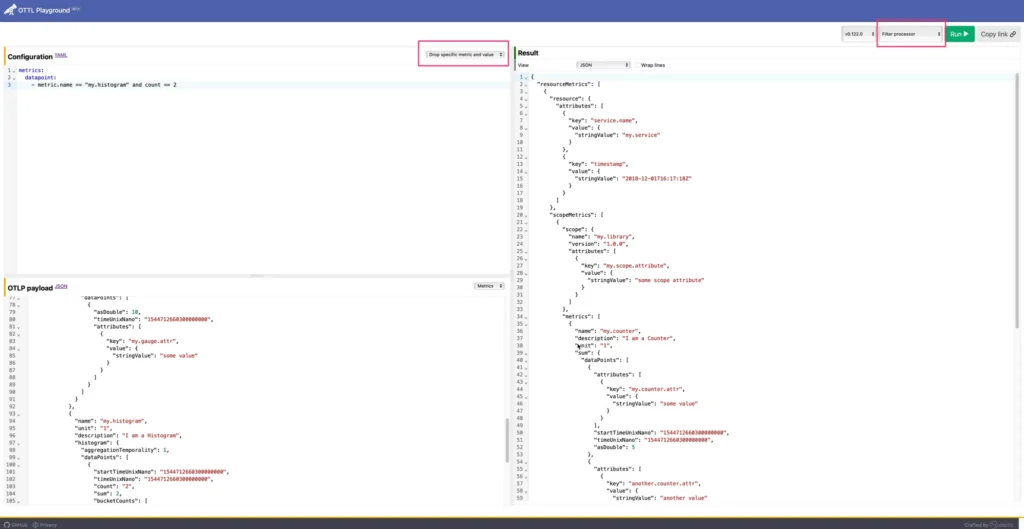
First up – a little terminology. In many cases, we might be generating telemetry from an existing proprietary agent such as DataDog, Dynatrace, New Relic etc… In most cases, a “receiver” is available to receive that telemetry and convert it to OTel format (OTLP JSON). You’ll note in the sample payload, there are “resource attributes” as well as “attributes” (labels or tags) on the metric datapoints themselves. Resource attributes describe the context of where telemetry data is coming from, while datapoint attributes (i.e. logs, traces and metrics in this example) capture information specific to individual telemetry events. So the resource attribute might tell you which K8s pod, namespace, service these metrics come from, whereas the metric attributes might have something specific like “user id” from our metric cardinality example above.
Here is the sample payload in case you need easy access to it:
{
  "resourceMetrics": [
    {
      "resource": {
        "attributes": [
          {
            "key": "service.name",
            "value": {
              "stringValue": "my.service"
            }
          },
          {
            "key": "timestamp",
            "value": {
              "stringValue": "2018-12-01T16:17:18Z"
            }
          }
        ]
      },
      "scopeMetrics": [
        {
          "scope": {
            "name": "my.library",
            "version": "1.0.0",
            "attributes": [
              {
                "key": "my.scope.attribute",
                "value": {
                  "stringValue": "some scope attribute"
                }
              }
            ]
          },
          "metrics": [
            {
              "name": "my.counter",
              "unit": "1",
              "description": "I am a Counter",
              "sum": {
                "aggregationTemporality": 1,
                "isMonotonic": true,
                "dataPoints": [
                  {
                    "asDouble": 5,
                    "startTimeUnixNano": "1544712660300000000",
                    "timeUnixNano": "1544712660300000000",
                    "attributes": [
                      {
                        "key": "my.counter.attr",
                        "value": {
                          "stringValue": "some value"
                        }
                      }
                    ]
                  },
                  {
                    "asDouble": 2,
                    "startTimeUnixNano": "1544712660300000000",
                    "timeUnixNano": "1544712660300000000",
                    "attributes": [
                      {
                        "key": "another.counter.attr",
                        "value": {
                          "stringValue": "another value"
                        }
                      }
                    ]
                  }
                ]
              }
            },
            {
              "name": "my.gauge",
              "unit": "1",
              "description": "I am a Gauge",
              "gauge": {
                "dataPoints": [
                  {
                    "asDouble": 10,
                    "timeUnixNano": "1544712660300000000",
                    "attributes": [
                      {
                        "key": "my.gauge.attr",
                        "value": {
                          "stringValue": "some value"
                        }
                      }
                    ]
                  }
                ]
              }
            },
            {
              "name": "my.histogram",
              "unit": "1",
              "description": "I am a Histogram",
              "histogram": {
                "aggregationTemporality": 1,
                "dataPoints": [
                  {
                    "startTimeUnixNano": "1544712660300000000",
                    "timeUnixNano": "1544712660300000000",
                    "count": "2",
                    "sum": 2,
                    "bucketCounts": [
                      "1",
                      "1"
                    ],
                    "explicitBounds": [
                      1
                    ],
                    "min": 0,
                    "max": 2,
                    "attributes": [
                      {
                        "key": "my.histogram.attr",
                        "value": {
                          "stringValue": "some value"
                        }
                      }
                    ]
                  }
                ]
              }
            }
          ]
        }
      ]
    }
  ]
}
The Least Metric Cardinality is no Metric at all…
Sometimes the best metric for high cardinality metrics is no metric at all – and it’s a surefire metric cardinality (and DataDog metric cardinality) fix! As stated above, custom metrics can be extremely easy to add, but do not always make business sense with hindsight. From the filter processor README, it states “If any condition is met, the telemetry is dropped (each condition is ORed together).” For example, to completely filter out the metric named my.guage:
metrics:
   metric:
     - 'name == "my.gauge"'
Or to filter out metrics with “count” in their name using regex, we can use:
 metrics:
   metric:
     - 'IsMatch(name, ".*count.*")'
Which should filter out the metric in the results pane, for the metric named “my.gauge” and “my.counter” respectively.
Label/Tag Metric Filtering
What about if we want to filter out all metrics that have a given label or tag? We can use a function built into the filter processor called HasAttrKeyOnDatapoint which will iterate through the map of datapoints on a given metric and drop the metric for a matching key string. For example, to drop metrics that have a key of "my.histogram.attr" , we would leverage a processor configuration like:
 metrics:
    metric:
      - 'HasAttrKeyOnDatapoint("my.histogram.attr")'
If you run this against the sample YAML above, you should find that the "my.histogram" metric is filtered out in the results.
Label/Tag Values Metric Filtering
Similarly, you can filter out metrics with datapoints that have a given key and value using another function called HasAttrOnDatapoint – for example the following example will filter out the "my.counter" metric from the results for the example above.
  metrics:
    metric:
      - 'HasAttrOnDatapoint("another.counter.attr", "another value")'
We can also selectively remove specific datapoints from a metric without dropping the entire metric
  metrics:
    datapoint:
      - attributes["another.counter.attr"] == "another value"
You should find that this filters out just this datapoint, but leaves the other datapoint in place for the my.counter metric. You can also leverage regex to remove a specific datapoint like:
    metrics:
      datapoint:
        - IsMatch(attributes["another.counter.attr"], "^another")
which should yield the same result as the prior example.
The Power of Control Planes
We’ve seen that the filter processor with the OTel collector can be a powerful tool for combatting metric cardinality. But our code is not static, and our metrics aren’t either. We can now unlock our development and engineering teams to instrument key business applications freely, without fear of racking up our observability bill, but we still need to remain vigilant. We need to proactively monitor the metrics (and cardinality) flowing through the system, and we need to be able to make changes quickly and easily to our collector fleet when we need to. We’ve seen a number of teams set up OTel collectors as a means to collect and route telemetry data from point A to B, but many teams are not tapping into the full potential of the OTel collector today. The Control Plane pattern is a well trodden model for cloud services and cloud native in general – and we can leverage it to gain control over our OTel collector fleets, and make changes quickly and easily to drive the desired business outcomes.
Summary
Metric cardinality (and DataDog metric cardinality) challenges in observability aren’t just about data volume—they’re about cost, complexity, and developer efficiency. Left unchecked, even well-intentioned instrumentation can spiral into high telemetry bills and operational overhead. But with OpenTelemetry and the filter processor, we gain a simple, powerful way to proactively reduce unnecessary metric permutations before they hit our observability backend.
By using tools like the OTTL and deploying filters in the OTel Collector, teams can drop overly granular metrics, strip out unneeded tags, and fine-tune what data flows downstream to address metric cardinality. And when combined with a control plane approach, we unlock dynamic, centralized control over our telemetry pipelines—helping us strike the right balance between insight and cost, and freeing developers to focus on what matters most.
Observability doesn’t have to be all or nothing. With the right controls in place, and just like Goldilocks (and baby bear’s porridge!), it can be just right.
Table of Contents
Logs. Understood. Instantly.
Analyze logs directly in your terminal with real-time insights and AI-powered pattern detection—no dashboards, no friction.
Get Gonzo Back
Backpress@controltheory.com