Happy New Year! and welcome to a new video series we’re calling “OTel in minute” – bite sized videos with actionable OpenTelemetry information you can use in less than a minute, or thereabouts!
If you’ve ever worked with the OpenTelemetry collector, you’ve probably had questions about the telemetry data coming in and out like of the collector:
- Is data even being received by the collector? If so, how is the telemetry (logs, metrics or traces) even being populated, for example what are the actual attributes or “resource attributes” fields and values?
- If I have processors in my pipelines to transform, enrich or optimize my telemetry, how do I know if they’re working as I expect?
Maybe you’ve sent you’re telemetry to the “debug exporter” in the terminal to take a look at, but this can be unwieldy and by definition, only tells you what’s coming out of a pipeline, not at the input or other stages along the way.
In this first video, we’re going to take a look at the “Remote Tap Processor” – a processor you can position any place in your OpenTelemetry Collector pipelines that provides you with a convenient sample of the telemetry flowing through it. This processor is part of the “contrib” repo on Github.
In our case, we’re going to run two Remote Tap Processors, with one at the start and one at the end of our pipelines.
Here’s our collector configuration, you can see two processors defined, one exposing a Websocket on port 12001 (the default) – the start of our pipelines – and one on 12002, for the end of our pipelines, and you can see these processors positioned at the start and end of our logs and traces pipelines here. We’re running our OpenTelemetry collector in a Docker container using this configuration on our localhost, making sure we expose these two ports on the container.
We’re using a handy utility called “Otelgen“ to source our telemetry and another utility called “websocat” to run a webcoket client to receive the sampled telemetry stream in our terminal.
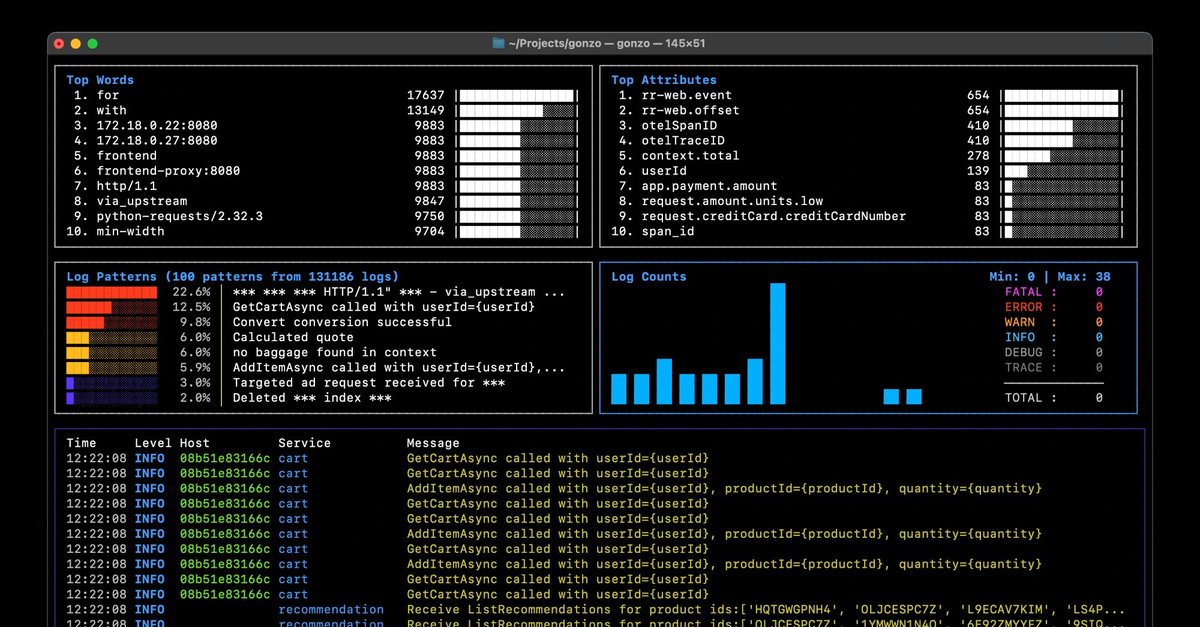
Let’s taking a look at the data coming into our logs pipeline – we’ve piped it to “jq” to help read the JSON better, we can now clearly see the attributes that are being populated – in this case K8s blah
In our configuration, we had a couple of processors to optimize our logs, to filter out low severity logs and deduplicate them respectively.
We can see the logs coming at the start of the pipeline on the left, and the end of the pipeline on the right, and by greping for the severity text, we see that we’re not getting any low severity logs coming out of the pipeline as expected
The deduplication processor adds an attribute to our logs with the number of logs deduplicated, we can see that attribute is being added successfully here and that we’re not getting much in the way of deduplication for this particular log stream
Well that’s today’s “OTel in a minute” for more information and step by step instructions, check out our blog! – speak to you next time!
 Back
Back